
If you put too much data in your MongoDB database, it will run your server out of memory. It can do that quickly too, so quick that you will not even be able to shutdown the mongo db process as the bash shell will no longer respond.
The solution to this is add another node to your cluster.
We illustrate what a server looks when it runs out of memory by purposely adding more data to an 8 GB machine than it can support and then running queries against that. Then we show what the logs looks like and what tools you can use to monitor this situation.
At 215 MB of data this server consistently used 11% of memory when hitting it with multiple searches. Then we added 3.5 GB of data at which point it locked up when it reached 92% memory usage.
(This article is part of our MongoDB Guide. Use the right-hand menu to navigate.)
When MongoDB Runs Out of Memory, Add Another Node
MongoDB is not an in-memory database. Although it can be configured to run that way. But it makes liberal use of cache, meaning data records kept memory for fast retrieval, as opposed to on disk.
MongoDB, in its default configuration, will use will use the larger of either 256 MB or ½ of (ram – 1 GB) for its cache size.
You can limit the MongoDB cache size by adding the cacheSizeGB argument to the /etc/mongod.conf configuration file, as shown below. But MongoDB uses both its internal cache and the system’s file system cache. So limiting it in one place will cut make it consume more in the other. So that’s not a solution.
storage:
dbPath: /var/lib/mongodb
journal:
enabled: true
wiredTiger:
engineConfig:
cacheSizeGB: 1
Free Monitoring Service From MongoDB
You should take advantage of the free monitoring service offered by MongoDB. That’s hosted on their web site, but that does not mean you need to use their cloud service (Atlas). It works with your own servers.
To use that, open the mongo shell and then paste in this command:
db.enableFreeMonitoring()
Part of their web page looks likes like this. You can see that on this 8GB machine it’s out of memory.This will cause MongoDB to send usage stats to their website where they will track those status and host it in a web page for you. They give you a URL to track your site. That’s a persistent URL as they assign a unique ID to your installation.
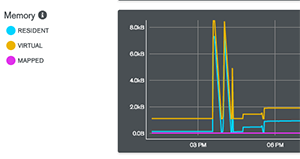
Show Memory MongoDB Usage
These metrics include cpu usage, etc. Above I show just the memory section. That is:
- resident—amount of actual physical memory (RAM) used by a process.
- virtual—RAM plus memory that has extended to the file system cache, i.e. virtual memory.
- mapped—MongoDB since version 3.2 does not do memory mapping of files anymore. That was used by the previous memory management module called MMAPv1. Now it uses WiredTiger by default.
To check your file system cache run free -k to show available virtual memory in kilobytes. Below is what my server looked like over 5 minute intervals when I ran the machine out of memory. The column to note is available. Divide the number shown by 1024*1024 to convert this number to gigabytes.
free -k
total        used        free      shared  buff/cache   available
Mem:        8173744     1088440     6753392        9052      331912     6816176
Swap:             0           0           0
total        used        free      shared  buff/cache   available
Mem:        8173744     4654600     2663432        9080      855712     3249520
Swap:             0           0           0
total        used        free      shared  buff/cache   available
Mem:        8173744     7992568      119508        9052       61668       45682
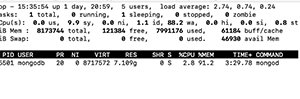
Of course you can use top -p (mongod pid) to monitor memory too. VIRT and RES are virtual and resident memory. Below you see that mongod is using 91% of the system’s memory in this example. At that point the system became unresponsive.
You can also get memory usage statistics from MongoDB in the shell:
db.serverStatus().mem
{
"bits" : 64,
"resident" : 907,
"virtual" : 1897,
"supported" : true,
"mapped" : 0,
"mappedWithJournal" : 0
}
If you have even done C or C++ programming you will be familiar with malloc. That is the system function you call when you need to reserve memory for your machine. When MongoDB can no longer do that these warnings start showing up in /var/log/mongodb/mongod.log:
2019-02-19T03:44:18.738+0000 I COMMAND [ftdc] serverStatus was very slow: { after basic: 202, after asserts: 686, after backgroundFlushing: 890, after connections: 1399, after dur: 1717, after extra_info: 2039, after freeMonitoring: 3003, after globalLock: 3389, after locks: 4073, after logicalSessionRecordCache: 4782, after network: 5520, after opLatencies: 6068, after opcounters: 6477, after opcountersRepl: 6818, after repl: 7441, after security: 7799, after storageEngine: 8616, after tcmalloc: 9676, after transactions: 10081, after transportSecurity: 10412, after wiredTiger: 22733, at end: 24170 }
Until it finally says:
2019-02-19T03:45:17.456+0000 F - [free_mon] out of memory.
You can also log into mongo and repeat the two commands below (you need to execute both to update the output) to watch your memory usage spike as your server goes downhill.
var mem = db.serverStatus().tcmalloc;
mem.tcmalloc.formattedString
Here is the output. As you can see it has exhausted all the available memory on this 8GB machine.You can also log into mongo and repeat the two commands below (you need to execute both to update the output) to watch your memory usage spike as your server goes downhill.
------------------------------------------------
MALLOC:       73048776 (   69.7 MiB) Bytes in use by application
MALLOC: +      3792896 (    3.6 MiB) Bytes in page heap freelist
MALLOC: +       508776 (    0.5 MiB) Bytes in central cache freelist
MALLOC: +       978848 (    0.9 MiB) Bytes in transfer cache freelist
MALLOC: +      1399344 (    1.3 MiB) Bytes in thread cache freelists
MALLOC: +      1335552 (    1.3 MiB) Bytes in malloc metadata
MALLOC:   ------------
MALLOC: =     81064192 (   77.3 MiB) Actual memory used (physical + swap)
MALLOC: +            0 (    0.0 MiB) Bytes released to OS (aka unmapped)
MALLOC:   ------------
MALLOC: =     81064192 (   77.3 MiB) Virtual address space used
MALLOC:
MALLOC:            816              Spans in use
MALLOC:             21              Thread heaps in use
MALLOC:           4096              Tcmalloc page size
------------------------------------------------
These postings are my own and do not necessarily represent BMC's position, strategies, or opinion.
See an error or have a suggestion? Please let us know by emailing blogs@bmc.com.