
IT-enabled business organizations operate in an increasingly dynamic environment as they seek to innovate, improve service quality, and proactively adapt to changing business needs. These changes drive process improvements in terms of delivering IT services and solutions to end users.
That’s why companies establish an IT service desk: to ensure the service delivery is managed according to organizational policies and that end users receive the necessary service support. Successful service desks design processes to deliver the best performance and support—for both the business organization and the internal and external users of IT services.
These service desk processes and resources must be evaluated based on insightful KPIs and metrics. To extract the insights and unlock the value underlying IT service desk metrics, these metrics must be compared against benchmarks. In this article, we will discuss why IT service desk benchmarks are important, offer real-world examples, and provide best practices for your IT service desk benchmarking initiatives.
Why IT service desk benchmarks are important
Without context and the right perspective, metrics can’t provide insights about real-world performance. You’ll need to understand not only how you define, collect, and understand the metrics you use, but also how those metrics map to decision factors on the business side.
Let’s look at a simple example. Imagine that your company wants to evaluate the productivity of your service desk agents, so you use metrics like tickets per user, average speed to answer, and first contact resolution (FCR)
A sudden change in these numbers—decreased FCR and speed to answer, increased tickets per user—alerts you to low productivity on the service desk. You might then conclude that the IT service desk performance has deteriorated and that the department needs an overhaul to mitigate the business impact of this change. As a result, you may replace and hire new staff, change the service desk process, or invest in new technologies to improve service desk performance.
This assessment of IT service desk metrics might be accurate. Or, alternative explanations could apply:
- The evolution of service issues. Not all issues offer same metrics performance. A sudden increase in time and resource-intensive service request may suggest that a larger userbase is experiencing complicated technical issues with prolonged resolution process. This is a common occurrence following a major downtime, cyber-attack, a new feature release, or change in the service desk process.
- Changing environment. Both the internal and external circumstances facing the organization can affect service desk metrics performance. Increased users or a sudden wave of issues facing third-party vendors operating the underlying infrastructure, such as ISPs, can also affect the service desk’s workload.
- Accuracy of metrics. A change in metrics data collection and KPI strategies affected the service desk productivity. This means that the metrics were perhaps not designed and collected accurately before, giving a false impression of service desk productivity.
Where to find IT benchmarks
This example illustrates how every metric can present multiple observations. Even simple KPIs can hold several, or false, meanings if you don’t establish appropriate context.
In order for service desk metrics to be useful tools for ITSM decisions, the metrics should be evaluated against an appropriate reference point: benchmarks. Benchmarks are simply a standard against which you can compare your metrics.
You can obtain service desk benchmarks from various streams:
- Past experiences
- Independent data collection companies or ITSM solutions providers that collect user data
- Research companies providing relevant surveys such as the SDI Service Desk Benchmarking Report and the HDI Practices & Salary Report
Examples of IT service desk benchmarks
Let’s review how an average IT service desk performs based on the SDI Benchmarking Report 2019. The report combines annual surveys distributed to 12,000 IT professionals between 2001 and 2019.
You can compare the performance of your IT service desk to the following benchmarking data describing staffing levels and performance.
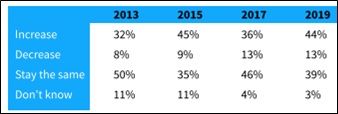
Change in expected staffing levels in coming years
Despite the proliferation of automation technologies and AI-based support solutions, the service desk will continue to rely on the workforce.
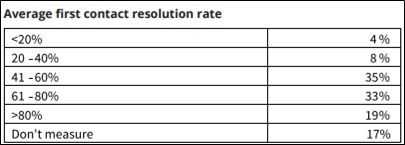
Average first contact resolution rate
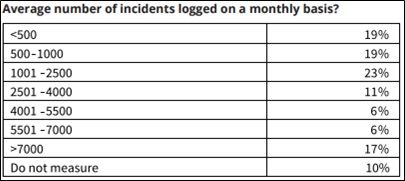
Average number of incidents logged per month
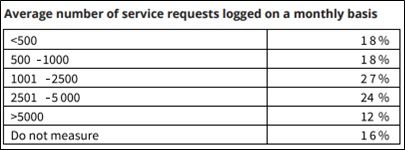
Average number of service requests logged per month
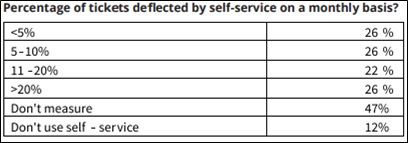
Percentage of tickets deflected by self-service per month
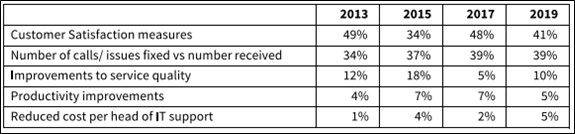
How companies measure customer satisfaction
Best practices for evaluating IT service desk benchmarks
Remember that these types of benchmark reports do not necessarily represent the industry standard, as they may account for a diverse range of service desk departments. The variations also arise from changing market conditions and evolution in the technology industry. In this regard, external IT service desk benchmarks may present a misleading view of your metrics and KPIs, which may have been collected and designed differently.
A better approach to evaluate your IT service desk performance is three-fold:
- Understand which metrics and KPIs can be most insightful.
- Ensure they are designed and measured accurately.
- Compare your results against a true and most applicable benchmark.
This benchmark is most relevant and accurate when it takes a holistic account of your organizational circumstances and past performance. Evaluate the metrics based on your past performance, with respect to the service desk process and resources that change over the years. The following steps can be taken to design your benchmarking report:
- Determine the scope. Identify which metrics and service desk functions will be covered under the benchmarking initiative.
- Identify channels to benchmark and compare. The benchmarking project can be designed to evaluate cost, productivity, workload, service level, and other decision criteria of your service desk.
- Collect data. Gather useful information from internal resources, past performance, and benchmarking reports available in the industry.
- Categorize and classify benchmarking data. Ensure that benchmarking comparisons accurately account for variations such as geography, demographics, and other parameters.
- Monitor and improve. Benchmarking may be an ongoing procedure, with the aim to improve how the reference information is collected and compared against appropriate datasets.
BMC for ITSM solutions
BMC Blogs has many resources on IT service desk metrics and best practices. Browse our Enterprise IT Glossary or see these articles:
- Service Desk KPIs: Top 5 Performance Indicators
- Agent Utilization as a Service Desk Metric
- Mean Time to Resolve (MTTR) as a Service Desk Metric
- Introduction to Critical Incident Response Time (CIRT): A Better Way to Measure Performance
- Creating a Service Desk Code of Conduct
- Service Desk Support Analyst: Roles and Responsibilities
- Introduction to the Enterprise Service Desk