
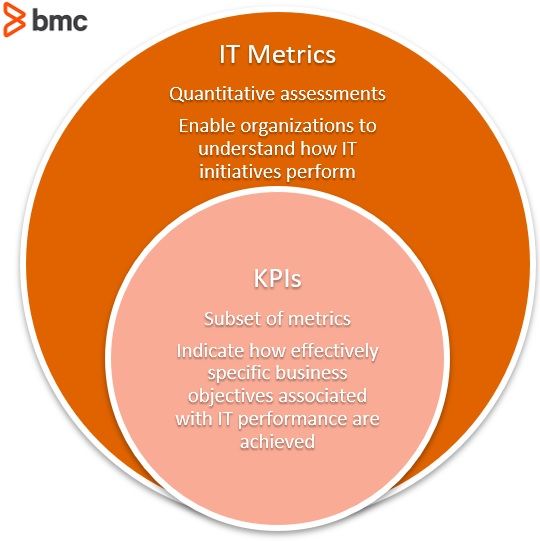
Understanding how well your service management initiatives are translating to business success is fundamental to planning your ITSM roadmap. The measurements you take need to give you direction for your improvement activities—so make sure you’re measuring the right things.
In this article, I look at the seven most commonly used metrics and KPIs that are used to indicate the quality of service management performance, how these can be measured, and the value they provide. I also suggest some new measures that provide insights into the way we manage modern IT services.
The traditional measures we will discuss here are:
- Service availability
- Time to resolve
- First-call resolution rate
- SLA breach rate
- User/customer satisfaction
- Cost per contact
- Net promoter score
The measures I would like to add into the mix are:
At the end, we’ll finish with choosing your metrics and additional resources on this topic.
Service availability
Most IT organizations define availability for IT services. Availability is typically determined by:
- Reliability
- Maintainability
- Serviceability
- Performance
- Security
Availability is most often calculated as a percentage. This calculation is often based on agreed service time (as defined in the SLA) and downtime.
I do have some issues with the way many organizations report on availability. Most SLAs will have a percentage of allowable downtime. Imagine this is two hours per month. A major outage could easily eat up all the downtime specified in the SLA—generally customers will understand in this situation.
But think about the situation where a critical service has constant, but short, interruptions. If the same service is unavailable 60 times each month for 2 minutes at a time, the customers will likely be less impressed as each of these periods of service interruption represents a disruption to productivity.
Tip: Ensure that your reporting represents not just the total downtime for the month, but also the number of service disruptions that your customer experienced during the same period of time.
Time to resolve
The mean time to resolve (MTTR) metric generally gives the average time taken to resolve an incident, once it is reported to the service desk. This is likely to be broken down by priority. This metric is closely tied to customer satisfaction: the faster you resolve issues, the faster your customer can get back to work.
You can make MTTR more meaningful by linking it more specifically to:
- Services
- Business units
I caution, however, that this metric can be easily ‘gamed’. If calls are closed too quickly, without confirming with the customer that everything is working as expected, the MTTR may look good—but your customers will not be happy.
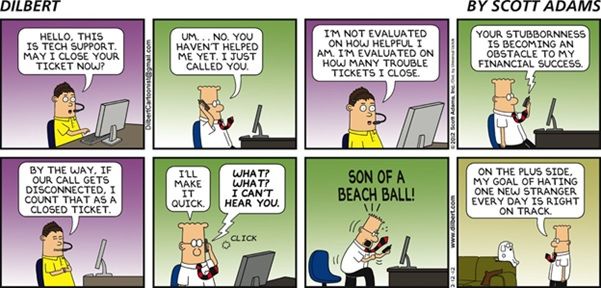
(Source)
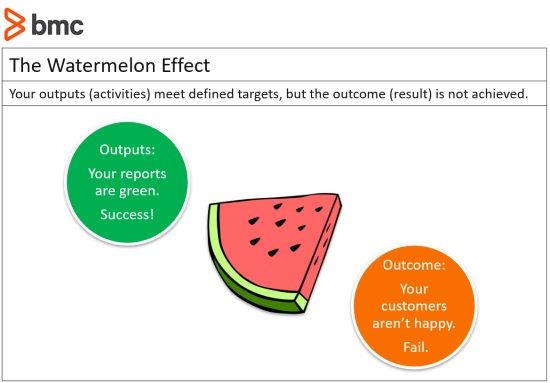
This leads to the phenomenon known as watermelon metrics. Your dashboards shine green, but when you cut it open, customer satisfaction is in the red.
Tip: Incentivising improvements in MTTR numbers can be counterproductive.
First contact resolution rate
First Contact (Call) Resolution (FCR) rate is the percentage of issues properly resolved during the customer’s first call, therefore eliminating any subsequent calls or interactions on the issue.
FCR rate is a valuable KPI, firstly because it results in a happy customer with no further action required.
Beyond that, there is a compelling business case for this metric. Service desk resources are far less costly than Level 2 and Level 3 support. The cost of an escalated call can be several times that of a call that the service desk is able to resolve on first contact.
Tip: This is another metric that can be gamified. Like MTTR, closing calls quickly—without assurance the issue is completely resolved—contributes to customer dissatisfaction.
SLA breach rate
A service level agreement (SLA) breach rate is the percentage of tickets that have broken, or breached, an SLA. For instance, if a critical ticket was resolved in eight hours instead of five hours, as required by an SLA, this ticket has breached the SLA.
Insufficient staffing and incapability of your staff are the two main culprits of SLA breach. Increased SLA breach numbers often leads to adding more training or more staff to prevent future breaches.
Tip: Regular breaches of SLAs can indicate that the SLA is unrealistic. There may be a case for going back to the customer to renegotiate or revisiting the underpinning operational level agreements (OLAs) to ensure they properly support the SLA agreed with the customer.
User satisfaction
End-user satisfaction is typically measured through a periodic survey or other feedback mechanism. Without measuring user satisfaction, a service desk can sometimes find itself focused too much on KPI—and not enough on the business outcome that the KPIs are intended to measure.
This is another area where you may notice the watermelon effect. Service management KPIs are all looking good, everything on the dashboards is glowing green, but those pesky customers are still not happy. When this happens, it is a good indicator that you’re either:
- Measuring the wrong things
- Analysing with the wrong lens
Tip: The primary purpose of service management is to provide services that customers and users are happy with, meet business expectations, and enable the organization to make progress towards its vision and mission. If your customers are not happy then it does not matter how good your other metrics look!
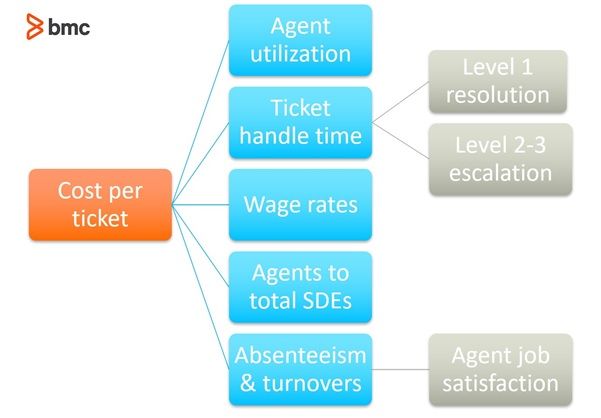
Cost per ticket
Cost per ticket (aka cost per contact) is essentially the dollar amount of operating expense of the Service management organization divided by ticket or contact volume. Typically, this is calculated on a monthly basis. Operating expenses often include:
- Salaries and benefits for personnel
- Hardware
- Software
- Telecommunications
- Other related expenses
While this metric will not impact on the service your customers experience, it is an important business measurement. Understanding the cost of support and assessing this in conjunction with other metrics such as customer satisfaction will give an understanding about whether the organization is under- or over-investing in support.
Tip: A very high customer satisfaction score along with a high per-ticket cost may indicate that you are spending too much on support. Consider reducing or redeploying some resources.
Net Promoter Score
Net Promoter Score (NPS) is a proven way of gauging—and improving—customer satisfaction and loyalty with a product, service, or company. One type of customer satisfaction scoring, NPS attempts to make customer satisfaction scores understandable by focusing on a single statistic.
You’ve likely taken an NPS survey if you’ve been asked the question, “On a scale of 0 to 10, how likely are you to recommend us to a friend or colleague?” NPS is calculated by subtracting the percent of low-satisfaction customers (scored 6 or below) from the high-satisfaction customers (scored 9 or 10), ignoring neutral scores (7 and 8).
Tip: NPS can be a useful KPI for ITSM organizations when considered alongside other critical metrics.
Calls reopened
Measuring the number of calls reopened—because you closed the incident before fully resolving it—is a good way to peel back the skin of the watermelon. If you are going to measure first call resolutions and time to resolve, then this metric becomes critical as it deters agents from being in too much of a rush to get their tickets closed.
Aim for complete satisfaction on an issue. Calls should only be closed when the person working on the issue is completely satisfied that it has been fixed.
Tip: A customer calling the service desk again to complain that you prematurely closed a call will have a far greater impact on customer satisfaction than a slower, but complete, resolution would have.
Knowledge articles published
Self-service knowledge articles are a newer but increasingly necessary tool. Improve customer satisfaction and reduce the service desk’s workload by giving customers the tools they need to resolve their own IT related issues with clear and concise knowledge articles.
New entrants to the workforce have a high level of digital literacy. They expect to be able to resolve most IT issues themselves. In their home lives, they will search for answers to IT problems online, so it makes sense to give them the tools they need for self-service in the office environment. (Of course, it does require some knowledge management.)
Tip: Measuring the number of knowledge articles that are published over a period of time, and seeing that number increase, will give a good indication of the health of your knowledgebase. There are obviously other important measures of knowledgebase health but start with this one.
End user knowledge article access
There are several things you can learn from this metric. Understanding how often your customers use the knowledgebase articles you are publishing will give an indication of the effectiveness of the information you are providing.
If articles are not being used, then it may simply be a matter of providing guidance and educating your customers about what self-help is available to them. After all, if they don’t know it’s there, they can’t use it.
Tip: Another useful insight that can be gained from this metric is how often particular issues arise. This metric can be valuable in the problem management space. While customers may be able to resolve an issue themselves, that issue will still contribute to a loss of productivity—which may warrant problem management intervention.
Choosing your metrics wisely
Metrics are, quite obviously, valuable tools that will allow you to manage IT services more effectively. However, they need to be treated with caution, as per Mark Twain’s cautionary statement:
There are three kinds of lies: lies, damned lies, and statistics.
It is very easy to game metrics, or to interpret them to support your own selected narrative.
The best advice I can give, which I’ve written about in detail, is this: Take a well-balanced selection of metrics that will allow you to see a holistic view of the ITSM landscape. Never view a single metric in isolation.
Remember that the final word belongs with your customer—their perception of how well you are performing is really the only one that matters. All other metrics are there to support the customer experience. If your metrics say you are doing well, but your customer disagrees, you need to take a closer look at what you are measuring.
Additional resources
To go deeper on ITSM metrics and KPIs, explore the BMC Service Management Blog and these articles: