
This article introduces you to Pandas, a data analysis library of tools that’s built upon Python. We will:
- Look briefly at the tool
- Show you how to perform basic operations
(This tutorial is part of our Pandas Guide. Use the right-hand menu to navigate.)
What is pandas?

A Python Pandas dataframe is more than an array data structure. Pandas is a powerful tool that lets you:
- Convert JSON, CSV, array, dictionaries, and other data to row and column format
- Work with them using names instead of indexes (you can still opt for indexes)
In short, Pandas is sort of like a spreadsheet, but one you work with using code, not Microsoft Excel. The biggest benefits:
- Pandas makes extremely complicated data transformations easy and natural.
- It includes a wealth of math, analytics, and other functions.
How pandas works
Pandas is built on top of NumPy and Matplotlib. So, Pandas can:
- Efficiently work with large n-dimensional arrays (NumPy)
- Take slices and transpose those into different shapes (NumPy)
- Draw charts (Matplotlib)
NumPy is the workhouse for most Python machine learning software development kits (SDKs). Since Pandas extends NumPy, it also supports machine learning operations.
Basic pandas operations
Now, let’s transition into an easy tutorial that shows you the Pandas basics.
Create a dataframe from an array
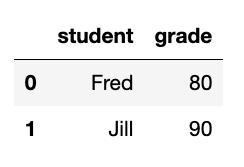
First create a dataframe from an array.
This is a 2×2 array (meaning its shape is 2×2). That’s two rows and two columns. The column names array must have two elements. Here, we put student and grade.
import pandas as pd
df = pd.DataFrame([["Fred",80],["Jill",90]],columns=["student", "grade"])
Then type df to see it. In a Jupyter Notebook, the display is formatted. (Below, we create a chart so you will need to use Jupyter, since Jupyter supports graphics.)
df
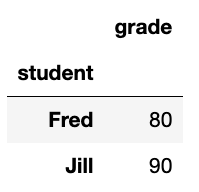
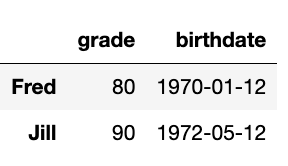
The dataframe index is just the row count, 0 and 1. It would be more natural to use the student name as the index. Use set_index to do that.
Normally Pandas dataframe operations create a new dataframe. But we can use inplace=True in some operations to update the existing dataframe without having to make a new one.
df.set_index("student",inplace=True)
Now it looks like this:
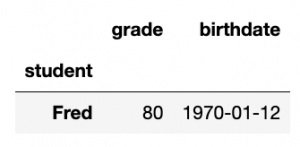
Add a column to a Pandas dataframe
Let’s add a column to the Pandas dataframe. This process you can do in place. It expects two values since we have two rows. We just dataframe[‘new column name’] to add the new column. It inserts the new column into the existing dataframe.
df['birthdate']=['1970-01-12', '1972-05-12']
Filter dataframe by column value
Here we select all students born on 1970-01-12:
df[df['birthdate']=='1970-01-12']
Produces:
Pandas Series: Select 1 column from dataframe
Here we select one column. This is not called a dataframe, but a series. It’s basically a dataframe of one column. But it’s a different type of object, so it has slightly different methods.
grade=df['grade']
Notice that index is still the student name. Pandas tells us that grade is of type int64—a 64-bit integer. This is because it uses NumPy, which supports lots of numeric types. Regular Python only supports integers and floats. So NumPy emulates them, just like the Python decimal object emulates decimal numbers.
student
Fred    80
Jill    90
Name: grade, dtype: int64
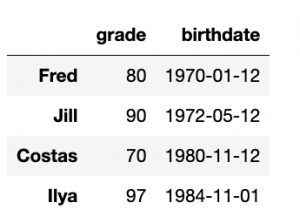
Add rows to a pandas dataframe
Let’s add some more students.
Here we create a new dataframe and append it to the existing one creating a new one, df3. In this example, in df2 we specifically give Pandas the student names as index values instead of doing that using set_index, as we did above.
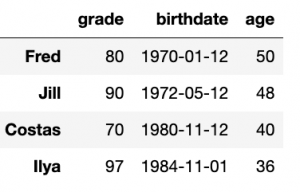
df2 = pd.DataFrame([[70,'1980-11-12'],[97, '1984-11-01']],index=["Costas", "Ilya"], columns=["grade", "birthdate"])
df3=df.append(df2)
Now we have some more students:
Select Pandas dataframe rows by index position
Here we select the first two rows using iloc, which selects by index offset.
df3.iloc[0:2]
Produces:
Pandas map function & scatter chart
Just to illustrate what else Pandas can do, let’s make a scatter chart. We will plot age by grade.
First we need to convert the birthdate to a number. We will make it of Numpy field of type datetime64 using:
bday=pd.to_datetime(df3['birthdate'])
bday is a series.
Then let’s calculate today’s date:
from datetime import datetime
import numpy as np
today = datetime.now()
Then we show how to use the map function. That runs over every row in the dataframe or series.
Someone’s age is today’s date minus their birthdate. That subtraction gives us a timedelta object, so we divide it by 365 days per year np.timedelta64(365, ‘D’) to give a very close estimate of their age. (Not all years have 365 days.) If we did not do that the age would be a time delta object and not a single integer value.
bday.map(lambda l: int((today-l)/np.timedelta64(365, 'D')))
df3['age']=bday.map(lambda l: int((today-l)/np.timedelta64(365, 'D')))
Now it looks like this:
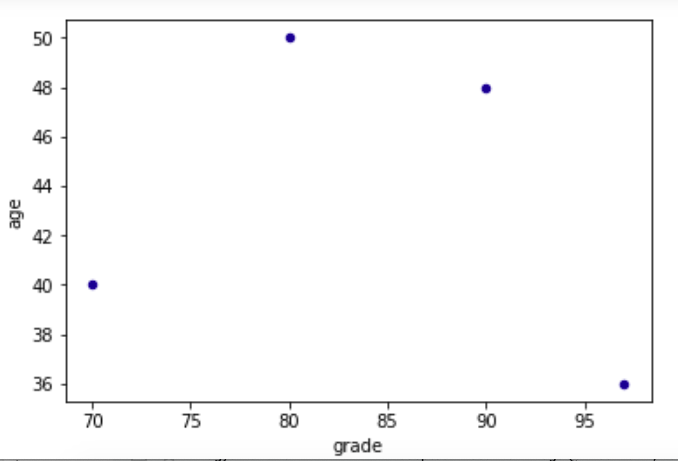
Now we illustrate how Pandas includes Matplotlib by plotting grade versus age. We tell it what column to use for the x and y axis as well as the color for the dots.
df3[['grade','age']].plot.scatter(x='grade',
y='age',
c='DarkBlue')
Here is the chart:
Show correlation between columns
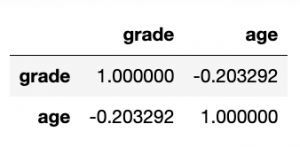
Just to illustrate one more feature, let’s see if age is correlated with grade. Of course, it’s not, but let’s just show that Pandas has this and many other advanced capabilities.
df3[['grade','age']].corr()
So, you can see that obviously grade is perfectly correlated (1.0) with itself but not at all with age (< 0):
Additional resources
For related reading and tutorials, explore these resources:
- BMC Machine Learning & Big Data Blog
- Python Development Tools: Your Python Starter Kit
- Top Machine Learning Frameworks To Use in 2021
- Data Visualization Guide, a series of tutorials using different tools
- MongoDB Guide, a series of MongoDB tutorials
These postings are my own and do not necessarily represent BMC's position, strategies, or opinion.
See an error or have a suggestion? Please let us know by emailing blogs@bmc.com.