
NumPy does a lot more than create arrays. This workhorse also does statistics and functions, such as correlation, which are important for scientific computing and machine learning.
We start our survey of NumPy statistical functions with bincount().
(This tutorial is part of our Pandas Guide. Use the right-hand menu to navigate.)
The bincount function
In NumPy, the bincount function counts the number of unique values in an array.
First we make an array with:
- Three 1s
- Two 2s
- Five 4s
- One 5
arr = np.array([1,1,1,2,2,3,4,4,4,4,4,5])
Results in:
array([1, 1, 1, 2, 2, 3, 4, 4, 4, 4, 4, 5])
Then we use the NumPy bincount() function to count unique elements.
d=np.bincount(arr)
Results in an array of counts by index position. In other words, it counts from left to right.
Note the 0 in front. For whatever odd reason, NumPy returns one more bin than the size of the array. So, we will make some adjustments for that.
array([0, 3, 2, 1, 5, 1])
We make an array with unique elements from arr. We do this so we can plot the count against the values later.
a=np.unique(arr)
Results in:
array([1, 2, 3, 4, 5])
Because NumPy returns one more bin than the size of the array, we insert a 0 at the beginning so that the unique count and the bincount are the same shape so we can plot them.
b=np.insert(arr,0,[0])
This gives us:
array([0, 1, 1, 1, 2, 2, 3, 4, 4, 4, 4, 4, 5])
Then we make a unique list out of that:
c=np.unique(b)
Now it has the extra 0 to line up with the bincount
array([0, 1, 2, 3, 4, 5])
Now c and d are the same shape, so we can plot them using Matplotlib.
plt.bar(c,d)
Results in this chart:
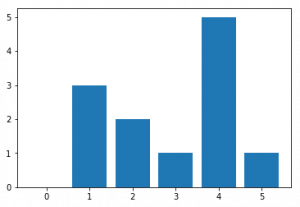
As you can see, there are:
- Five elements with value 0
- One element with value 3
The complete code
Here is the complete code.
import numpy as np
import matplotlib.pyplot as plt
arr = np.array([1,1,1,2,2,3,4,4,4,4,4,5])
d=np.bincount(arr)
a=np.unique(arr)
b=np.insert(arr,0,[0])
c=np.unique(b)
plt.bar(c,d)
Related reading
- BMC Machine Learning & Big Data Blog
- Python Development Tools: Your Python Starter Kit
- Data Visualization Guide, a series of tutorials
- Snowflake Guide
- Data Storage Explained: Data Lake vs Warehouse vs Database
- Predictive Analytics vs Machine Learning: What’s The Difference?
These postings are my own and do not necessarily represent BMC's position, strategies, or opinion.
See an error or have a suggestion? Please let us know by emailing blogs@bmc.com.