
Is your service desk consistently delighting your customers? Or, if they had a choice, would they be going elsewhere for their IT support? Is your knowledgebase or service desk team the first place your customers think to ask for advice, or do they head straight to Google and online forums for advice?
If you don’t know the answers to these questions, you need to first ask yourself, “How do I find out the answers to these questions?”
There’s more to creating a world-class service desk than embracing the right tools and principles. To make sure your vision is translating into reality, it’s essential to measure the effectiveness of your service desk in the areas that matter most for efficiency, effectiveness, and customer satisfaction. There are endless key performance indicators (KPIs) to choose from, some more meaningful than others.
In this article, we will explore the most important measurements you should be paying attention to. These are basic metrics that every service desk should track. Only once you get these right can you start adding additional measurements—the icing on the cake—but I caution: you need to get these basics in place first.
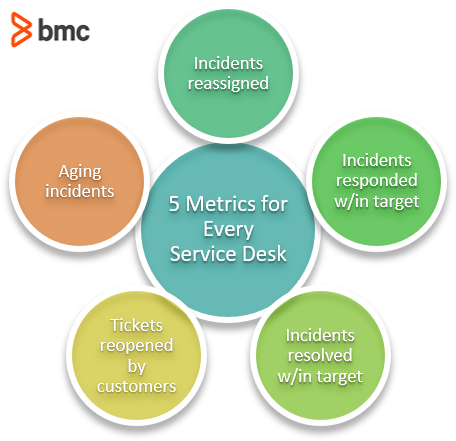
1. Incident reassignments (Increase/decrease)
Incidents and requests that are moved among support teams take longer to resolve. Getting assignments right the first time will save time, increase productivity, and improve customer satisfaction. Utilising automation and artificial intelligence to direct calls to the right team can help you improve in this area.
- Reporting frequency: Monthly
- Measurement procedure: Count of incident re-assignment per ticket
- Target range: < 5
2. Incidents responded within target (Increase)
Your responsiveness to reported incidents is a critical factor in both customer satisfaction and the credibility of IT among business users. Letting your customer know that their issue has been logged and somebody is looking at it is a good start.
When this metric is static or increasing, that’s generally positive. Any significant or prolonged decrease might require changes. Make sure you’re meeting expectations by hitting defined service level targets, and work to continually improve your success rate.
- Reporting frequency: Weekly/Monthly/Quarterly
- Measurement procedure: Incident Responded within Target/Total Resolved Incidents * 100
- This should be measured by Priority where Critical is 100%
- Target range:
- > 95% = Green (Good)
- 90-95% = Yellow (Acceptable)
- <= 90% = Red (Concern)
3. Incidents resolved within target (Increase)
The primary function of the service desk is to ensure that customer issues are resolved as quickly as you’ve promised. This is different from the above metric, which focuses on response time. This one is about resolution time.
An increase in this metric validates your core effectiveness as a service desk: you’re resolving incidents within defined service level targets.
- Reporting frequency: Weekly, monthly, and/or quarterly
- Measurement procedure: Incident Responded within Target/Total Resolved Incidents * 100
- This should be measured by Priority where Critical is 100%
- Target range:
- > 95% = Green (Good)
- 90-95% = Yellow (Acceptable)
- <= 90% = Red (Concern)
4. Tickets reopened by customers (Decrease)
Nothing annoys customers more than having their tickets closed when the incident is still active, or the fix turns out to be temporary. Here, a decreased in reopened tickets is a good thing—customers agree you’ve satisfactorily solved the issue. An increase here could indicate some anomalies, but too many means you’re missing something major.
- Reporting frequency: Weekly or monthly
- Measurement procedure: Percentage of tickets reopened at customer’s request
- Target range: < 2%
5. Aging incidents by priority (Backlog decrease)
Your backlog should keep you up at night—it might well be costing your business users some sleep, too. Clear out aging incidents (defined as those more than 14 days old) to keep users satisfied and avoid high support time and cost.
If your backlog is climbing, you need to understand why and do something about it. It could be a resourcing issue, or perhaps your team needs training in new services that have been introduced recently. When tickets are sitting in your backlog for extended periods of time, customers will rapidly become unhappy with the service you are providing.
- Reporting frequency: Weekly, monthly, and/or quarterly
- Measurement procedure:
- Aging: (Today’s date – submit date)
- Untouched tickets: (Today’s date – date incident last modified)
- (Aging incident count / total open incident *100)
- Target Range:
- Overall < 30%
- Or by priority level
- Critical: 0%
- High: < 5%
- Medium: < 10%
- Low: < 15%
Beware watermelon metrics
The metrics in this list are a very basic starting point that will help you to understand the effectiveness of your service desk function. Get these right and consistently within SLA requirements and you will be on the way to providing a service desk that meets your customer needs.
I would, however, caution you to beware of “watermelon metrics”. At the same time as you are measuring these quantitative metrics, you need to be measuring customer satisfaction.
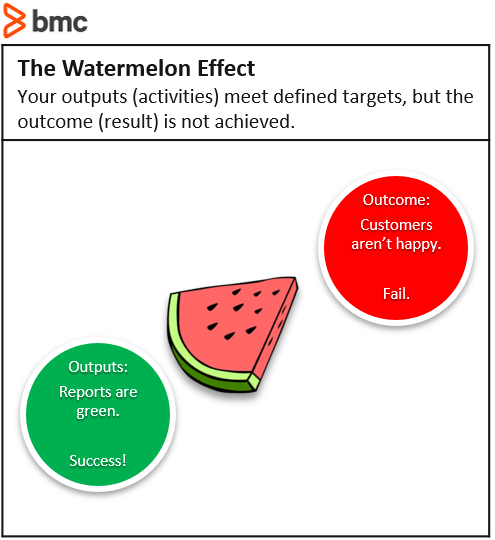
If all the metrics we have described in this article are showing as green, but your customers are not happy, you will need to reassess what you are measuring and what the results are telling you.
Above all, listen to your customers. At the end of the day, their satisfaction is the only metric that matters.
Additional resources
For related reading, explore these resources: