
In Kubernetes (K8s), monitoring involves various tools, metrics, and methodologies to examine the health status of cluster components. The process essentially allows developers and administrators to keep a check on issues that may arise when operating workload on complex and distributed clusters.
Due to the enormous number of connected services and resources within a cluster, monitoring Kubernetes often requires special attention. This is because tracing changes and logging events in distributed cluster components comes with its own sets of added complexity.
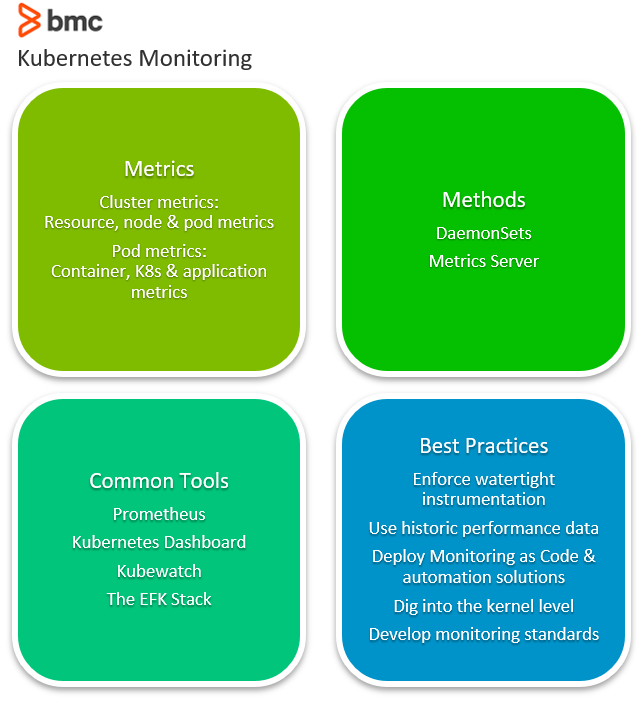
Let’s explore various aspects of Kubernetes monitoring, including:
(This article is part of our Kubernetes Guide. Use the right-hand menu to navigate.)
What is Kubernetes monitoring?
Kubernetes makes it easier to run distributed, containerized workloads. But, this model also introduces the complexity of handling distributed and connected compute elements.
In such complex setups, monitoring is crucial to the management of an application’s lifecycle since it helps debug issues that arise when the cluster is operational. Monitoring is the practice of scanning all critical components to ensure there are no single points of failure in a cluster.
Some key reasons for Kubernetes monitoring include:
- Ensuring resources are consumed optimally by a team or a particular application
- Balancing loads across instances of the application hosted on separate nodes
- Automatically taking advantage of newly available resources when a new node joins a cluster
- Redeploying workloads to other nodes when one host goes down
- Efficient provisioning of updates and rollbacks when necessary
(Understand the differences between monitoring and observability.)
Kubernetes monitoring metrics
Various metrics help developers ensure production workloads are running efficiently. These metrics are critical events of containers, PODs, nodes as well as the application, that collectively enable monitoring tools to derive a profile from the cluster’s characteristics.
When examining a Kubernetes cluster, performance metrics can be categorized into:
- Cluster metrics
- Pod metrics
Cluster metrics
These metrics enable developers to examine the behavior of all nodes and related resources in a cluster. Such metrics help the administrator to:
- Monitor whether the cluster is running as intended
- Flag resource and capacity utilization of the application
- Keep tabs on each node workload
Some important cluster-level metrics include:
- Resource-based metrics. These include all metrics related to the consumption of compute resources including CPU, disk & memory utilization, and network bandwidth consumption.
- Node-based metrics. The number of nodes which allows developers to track the cost of running the cluster on managed platforms and understand the workload running on cluster nodes.
- Pod-based metrics. The number of running PODs so developers can be sure that sufficient nodes are provisioned and that the cluster can handle changing workloads in the event of node failure
Pod metrics
Monitoring tools can also be used to observe specific POD behavior and how Kubernetes handles a deployment. POD metrics can be of three types:
Container metrics. These metrics are exposed by the metrics server by making them available through cAdvisor, a container-centric service. Container metrics include:
- Container network usage
- CPU consumption
- Network bandwidth consumption
Kubernetes metrics. These metrics monitor how well a deployment has been orchestrated and the status of a POD. Kubernetes metrics include:
- The POD’s health status
- Deployment progress
- Network data
- The number of POD instances currently running
Application metrics. These metrics are developed within the application’s code, so they are more in tune with business case requirements.
For instance, an eCommerce app may expose data on metrics such as:
- The number of users currently logged in
- Revenue within a certain time period
- Clicks per hour
A database application, on the other hand, can expose metrics related to the data being tabulated.
During the course of monitoring, applications typically expose these metrics to the Kubernetes monitoring tools through an API.
Kubernetes monitoring methods
When it comes to extracting metrics data from Kubernetes clusters, there are two main approaches:
- Monitoring using DaemonSets
- Monitoring using the Metrics Server
Monitoring using DaemonSets
A DaemonSet is a specialized POD that ensures that a snapshot of its workload runs on all nodes within the cluster. Developers can create a DaemonSet that runs a monitoring agent on every node in the cluster to collect performance metrics.
Because it’s easy to provision, plenty of Kubernetes monitoring solutions use a DaemonSet approach to deploy monitoring software on cluster nodes for examining health of the POD along with performance data.
Monitoring using the Metrics Server
Formerly known as Heapster before it was deprecated, Metrics Server sends performance data to a storage server designed to obtain cluster statistics. As opposed to a DaemonSet, a Metrics Server acts as a normal POD that collects performance data from the Kubelet service and uses the Metrics API to expose them to the kube-apiserver.
A Metrics Server is highly scalable and is considered capable to monitor clusters of up to 5,000 nodes using a single deployment—an efficient choice for clusters with large workloads.
Popular K8s monitoring tools
Here’s a brief rundown of popular K8s monitoring tools.
Prometheus
Prometheus is an open-source, community-driven monitoring tool managed by the Cloud Native Computing Foundation. This tool stores data as a time series that can easily be accessed via a custom query language, then rendered in a built-in browser presentation.
Through the Prometheus Operator, provisioning its monitoring tool on a Kubernetes cluster is relatively simple compared to other popular tools.
Kubernetes Dashboard
Maintained as part of the Kubernetes stack, this UI-based tool comes out-of-the-box with plenty of features that allow developers to manage workloads and check run-time resource utilization.
Through a number of different views this tool provides detailed insights including Persistent Volume Claims, ConfigMaps, workload kinds, CPU and memory usage, etc., across all nodes of a cluster.
Kubewatch
Kubewatch is a monitoring agent that notifies developers of events and logs through collaboration channels such as Slack and MS Teams.
By allowing developers to specify the resources in a YAML file, Kubewatch allows developers to integrate notifications with the collaboration channel through a webhook. Instead of being a full-fledged monitoring tool, Kubewatch is an event notifier that pulls critical events of a Kubernetes cluster to specified channels for developer insight.
The EFK Stack
EFK is a stack of tools comprising ElasticSearch, Fluentd, and Kibana that collectively provides logs and critical insights of an operational Kubernetes cluster. These tools work together to:
- Collect cluster logs (through Fluentd)
- Store them centrally (ElasticSearch)
- Visualize the metrics (Kibana UI)
This stack is particularly useful for:
- Detecting issues as they arise
- Presenting issues in a simple GUI
Best practices for K8s monitoring
Kubernetes monitoring presents a few challenges specifically for:
- Microservices architecture
- Ephemeral containers
- High scaling instances
Many Kubernetes best practices support cluster efficiency. Here are some best practices to make the most out of the available monitoring solutions:
- Enforcing a watertight instrumentation strategy that enables monitoring tools to collect accurate data without missing any resource within a cluster.
- Including historical performance data to uncover unseen issues.
- Deploying Monitoring as Code solutions to enable automation while improving team productivity and cluster performance.
- Digging deep to uncover performance issues at the kernel level.
- Developing organization-wide monitoring standards to keep monitoring at the core of development.
Monitoring promotes cluster efficiency
Automating Kubernetes administration requires a focused approach, dedicated tools, and the right methodologies in order to proactively monitor cluster resources. By provisioning an efficient monitoring mechanism, organizations can:
- Increase cluster efficiency
- Reduce operational costs (OpEx)
- Proactively maintain resources at optimum standards
Related reading
- BMC DevOps Blog
- Application Performance Management in DevOps
- Managing Containers & Code for DevOps
- How To Monitor NGINX Using Kibana & Elasticsearch on Docker
- The 12-Factor App Methodology Explained
- Cloud Monitoring: Choosing the Right Metrics
These postings are my own and do not necessarily represent BMC's position, strategies, or opinion.
See an error or have a suggestion? Please let us know by emailing blogs@bmc.com.