
According to ITIL®, availability refers to the ability of a configuration item or IT service to perform its agreed function when required. It is calculated by using this equation:

- Agreed service time is the expected time the service will be in operation. If your service level specifies that users must have access to an ERP system from 6:00 AM to Midnight on workdays, your agreed service time is 18 hours/1,080 minutes/64,800 seconds per workday.
- Downtime is the amount of time during the agreed service time that the service is not available.
Availability is measured as the percentage of time your service or configuration item is available. It reports on the past and estimates the future of a service. It tells you how well a service performed over the measurement period.
Availability metrics also estimate how well a service will perform in the future. In our ERP availability example, an average availability of 99.99% would predict we could expect an average uptime for our service of 17.9982 hours/1079.892 minutes/64,793.52 seconds per day. We can compare calculated against promised availability to determine if we are meeting our business goals.
Small missteps lead to big drop-offs
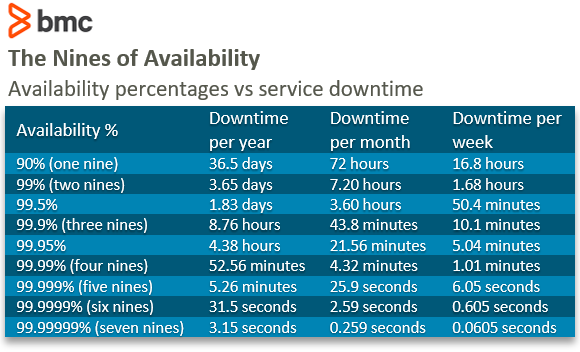
Small variations in availability percentages go a long way. The table below shows how much downtime we can expect at different availability percentages.
At 99.999% availability (also known as five nines), we can only expect 5.26 minutes of downtime a year. But if we let availability slip to 99%, downtime goes up to 3.65 days a year. If you do not think availability tracking is important, ask your executives if they would like to have their online store unavailable for 3.65 days each year.
(Source)
This is why vendors sell products with five nines availability, and customers want SLAs where their services are guaranteed 99.999% uptime. There are real consequences in keeping service availability under control.
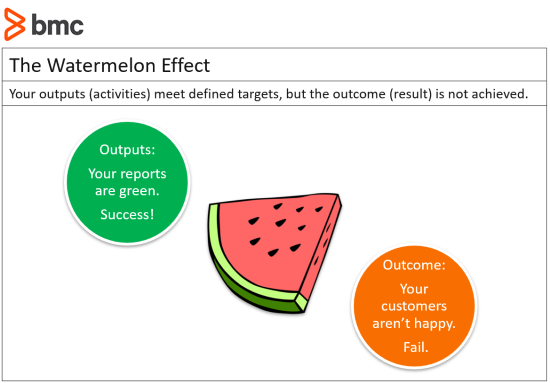
Avoiding the “watermelon effect” in service availability
Do not assume good availability statistics translate into good customer outcomes. Be aware—this assumption can lead to the “watermelon effect”, where a service provider is meeting the goal of the measurement, while failing to support the customer’s preferred outcomes.
Let’s say you are a telecom provider with 99.9% weekly availability (.1% or 10 minutes of downtime a week). But that .1% downtime occurs during high usage events, such as a record stock trading day, the live finale of a mega-popular TV show, or Amazon Prime day. You reached your availability targets, but your customers are unhappy. This is the classic watermelon pattern, green (good) on the outside, red (bad) on the inside.
How to improve availability measurements
Availability should always support a customer’s desired outcomes. Here are some ways to create availability metrics that matter.
Create clear metrics
Your metric should be clearly understood and related to the critical business processes being measured. Work with your customers so that you can measure what is important and critical to their business outcomes. And be precise. If you are measuring ERP system availability on a wide area network, what constitutes an outage: one person down, one location down, two locations down, or the entire network down? Answers to questions like these can have a big effect on your perceived availability and help you to avoid the watermelon effect.
Measure availability only over the required timeframe
Availability should be measured against the time the service is required or its required service level. If the business goal is to enter and process orders while the business is open, it will dilute your measurements to factor in uptime during off-hours, weekends, and holidays. Only measure availability against its required agreed function.
Look and report on duration and frequency of downtime
You have had 30 minutes of downtime this week. When did it happen? Was it one time of 30 minutes when a technician accidentally downed a router, or was it 10 times of three minutes each where no one knows what happened? Be sure you can break down and look at how long each individual outage was (duration) and how often an outage occurs (frequency). Look at how you can parse your availability numbers to understand and fix your issues.
Use availability as an input into your continuous improvement process
Do not be content to just report on availability, duration, and frequency. Investigate why your outages happened. Use availability information for your continuous improvement cycle.
Collecting agreed service time statistics
The biggest challenge in calculating availability is in gathering all the necessary service time values. Data collection methods range from the simple to the complex. Some of the more common ways that availability data can be collected include:
- Gathering manual input from IT personnel and personnel
- PING testing critical equipment and reporting when unanswered PINGs are sent
- Culling availability numbers from Service Desk tickets
- Using monitoring and reporting capabilities in end-to-end service and operations platforms, such as BMC Helix
- Using data collection software, such as TrueSight Operations Management, to gather and analyze data from various sources
- Collecting and using data from log management systems (LMS) and security information and event management (SIEM) systems
Monitoring availability
Service availability is a simple idea, but the difficulty is in the details. Plan your availability measurements around the customer’s critical business processes and outcomes. Be sure to use availability statistics that make sense to everyone and that measure availability over the required timeframe. Use tools and methods that get the information you need. Go beyond simple availability to report on the frequency and duration of your downtime. And use availability information to improve the process.
Additional resources
For more on this topic, browse the BMC Service Management Blog and these articles:
- Impact of Redundancy on Availability
- System Reliability and Availability Calculations
- ITIL v3 Guide and ITIL 4 Guide, each with 20+ articles
- Service Level Management in ITIL 4
- A Primer on Service Level Indicator (SLI) Metrics