
Plotly is a charting framework for Python and other programming languages. What makes Plotly different is that it supports JavaScript, so it will respond to mouse events. For example, you can make annotation boxes pop up when someone moves the cursor over the chart.
Plotly does not natively handle Python Pandas DataFrames. To make Plotly work with these, you’ll need to convert those to dictionaries first or use plugins.
A large collection of charts is available in this public repository and grouped into these categories:

Note: Plotly is free, and they offer paid versions including the Chart Studio platform where they say you can create charts without programming. That’s slightly misleading, as you would still need to write code to transform the data, but you can try that for yourself.
(This article is part of our Data Visualization Guide. Use the right-hand menu to navigate.)
Plotly Python example with code and data
Here we give an example of how to draw the simplest of Plotly charts and what you need to get started with using it with Python. The code is available here and the data here.
First, you need to use Zeppelin or Jupyter notebook for a graphical environment in which you can both draw charts and display graphics.
Then, add Plotly to Python like this.
pip install plotly==4.2.1
The code, explained
Before we get into the code, a couple notes:
- In addition to drawing the chart inline, you can save it as an HTML file. Look at that file and notice that it has both a graphic image and JavaScript to make it interactive.
- There might be some delay in generating the chart or it might not generate at all. We tested this code with Safari and Chrome browsers. If you search online, you’ll get conflicting instructions on how to display graphs in different graphical environments. If you’re still having problems generating a chart, get in touch with us at [email protected], include your OS and browser details, and we’ll take a look.
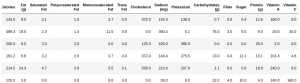
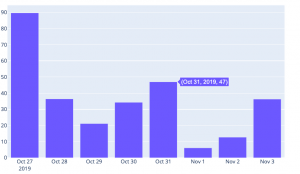
Now for the complete code. The data we use is diet information over an 8-day period. The first part looks like this:
Next, we import a CSV file, then plot x and y, where x is the date and y is a chosen column:
x=daily.index.values,y=daily['Carbohydrates (g)'])
Date was originally a column but since we grouped and summed the data by date…
daily = df.groupby('Date').sum()
…it became the dataframe index, so we use daily.index.values to get the values.
This is a simple bar chart (go.Bar) with x and y values.
from plotly.offline import plot
import pandas as pd
df = pd.read_csv("/home/ubuntu/Downloads/diet.csv")
daily = df.groupby('Date').sum()
import plotly.graph_objects as go
fig = go.Figure(
data=[go.Bar(x=daily.index.values,y=daily['Carbohydrates (g)'])],
layout_title_text="A Figure Displayed with fig.show()"
)
fig.show()
Finally, here is the resulting chart. Hover your cursor over a point to see the point’s value. That’s JavaScript doing the work for you.
These postings are my own and do not necessarily represent BMC's position, strategies, or opinion.
See an error or have a suggestion? Please let us know by emailing [email protected].