
When a service goes down in a complex microservices based architecture, traditional monitoring doesn’t help. Instead, distributed tools such as Jaeger help identify and isolate the infrastructure branches responsible for the IT incident.
With traditional monitoring tools, users can rely on metrics and logs to understand how well the systems are performing based on parameters well known to them. However, metrics only show how a specific parameter—in isolation and with limited correlation with an unidentified root cause—performs when an incident occurs.
Metrics are focused on individual node performance and rarely used to troubleshoot incidents impacting a specific service, for which users may not have adequate control, visibility, dashboards, or reporting.
Logs, on the other hand, are a mess. Especially with the complex enterprise architecture operating on decoupled cloud server systems offering limited visibility and control to the product owners, identifying the root cause itself is a complicated task.
What is Jaeger?
Jaeger is the most popular open source distributed tracing backend system. Jaeger was created and open sourced by Uber in 2015.
Distributed tracing allows users to correlate the problem across the nodes and service stack and narrow down the issue to the most probable source of the incidents that must be carefully troubleshooted.
How distributed tracing works
Distributed tracing follows a simple concept of propagating identifiers and collecting telemetry information as the service travels across the infrastructure nodes—a concept already adopted for various application development and monitoring tasks.
For example, a front-end service is assigned a unique ID. As the request for this service is executed across different parts of the infrastructure, a few things occur:
- The ID is propagated.
- The telemetry data from the nodes is collected and sent back to a backend service such as Jaeger.
The backend distributed tracing system such as Jaeger puts all of this information together and makes it available for querying on demand. The request execution process is then reconstructed into a graph or time-series visualization format to evaluate the service request execution journey. Any error is picked up and correlated with the IT incident, allowing users to find exactly where the root cause may exist.
Some of the additional tracing and troubleshooting capabilities of Jaeger backend systems include:
- Distributed context propagation is the underlying mechanism used to pass trace context in distributed infrastructure systems.
- Distributed transaction monitoring proves integrity for transaction-based software systems.
- Root cause analysis finds the nodes impacted by an IT outage or a service disruption.
- Service dependency analysis identifies the behavior of services based on the status of interdependent services.
- Performance and latency optimization helps to understand the performance behavior across nodes, identifying performance bottlenecks that add latency to the network data transmission and optimizing workload distribution.
Jaeger architecture
Jaeger can be deployed with all individual components operating within a single process or as an entirely distributed system containing the set of components described in the article below, where we review the direct-to-storage Jaeger architecture. The trace metrics are written by the Jaeger collector directly into the database and the UI is used to visualize the network behavior:
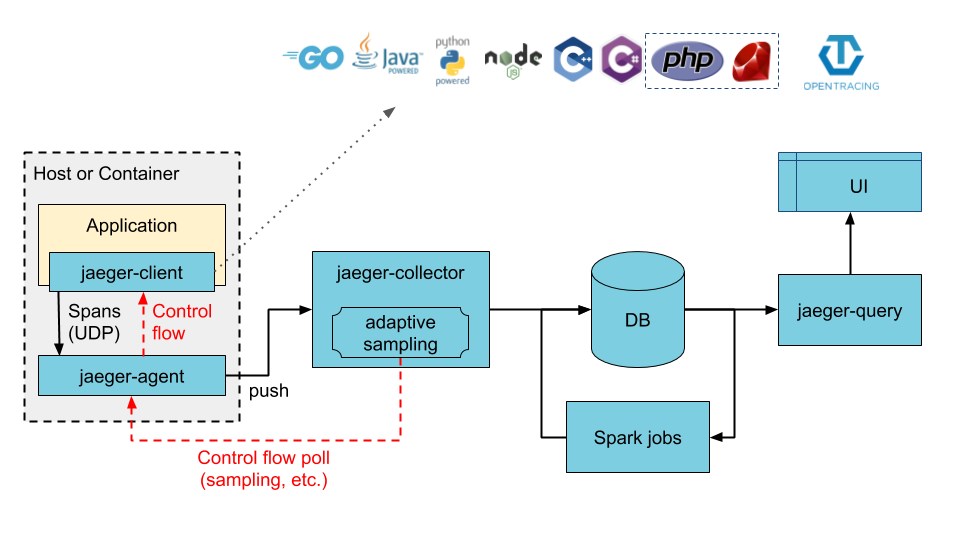
- Jaeger client. The tracer implementing the OpenTracing API. The system can integrate with open source frameworks such as Camel (Fuse), Spring Boot (RHOAR), MicroProfile (RHOAR/Thorntail), Wildfly (EAP), or use manual implementations.
- Jaeger agent. The server queue records Spans and sends them to the Jaeger Collector as a batch. A sidecar system implemented in containerized environments may be used to facilitate the Jaeger Agent process. Spans in Jaeger refer to the logical unit for workload duration and also contains appropriate tags and logs to determine the starting and ending period of the request.
- Jaeger collector is the queue system that receives Spans, places them in a queue and returns relevant information when queried at a later stage.
- Storage refers to the persistent storage backend. Currently supported systems include Kafka, Cassandra, and ElasticSearch.
- Query service retrieves information from the Jaeger backend.
- Ingester refers to any ingester service (optionally) such as Kafka that reads the incoming data and writes it into a different backend storage system, such as Cassandra or ElasticSearch.
- Jaeger Console is the interface that visualizes traces and span details.
Jaeger in a technology stack
Jaeger is largely a community-driven project with more than 1,750 contributors, 4,300 code commits and 302 contributing companies, as of 2020.
The technology stack supports a variety of programming languages and frameworks including:
- Go programming language for Jaeger backend
- Pluggable backend storage layers include Cassandra, ElasticSearch, badger in-memory storage, and Kafka
- React/JavaScript for the frontend
- OpenTracing instrumentation libraries: Go, Java, Python, NodeJS, C#, C++ and community-based support of PhP and Ruby is in process
- Integration with Kafka, Apache Flink for streaming, and Apache Spark for data collection
Related reading
- BMC DevOps Blog
- Tracing vs Logging vs Monitoring: What’s the Difference?
- How Containers & Kubernetes Work Together
- Data Architecture Explained: Components, Standards & Changing Architectures
- Kubernetes Monitoring: A Comprehensive Guide
These postings are my own and do not necessarily represent BMC's position, strategies, or opinion.
See an error or have a suggestion? Please let us know by emailing blogs@bmc.com.