
Data analysis, data analytics. Two terms for the same concept? Or different, but related, terms?
It’s a common misconception that data analysis and data analytics are the same thing. The generally accepted distinction is:
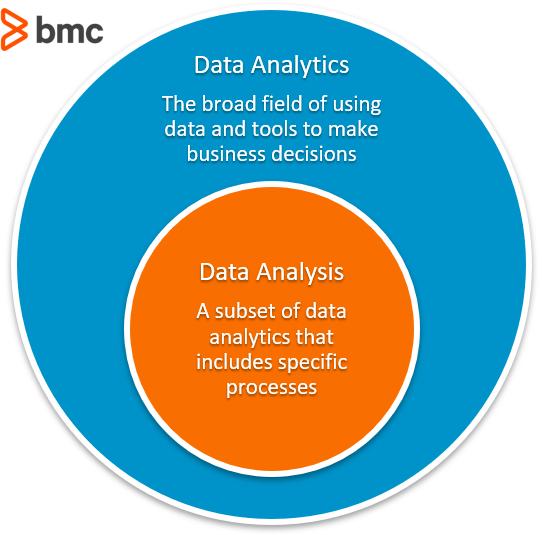
- Data analytics is the broad field of using data and tools to make business decisions.
- Data analysis, a subset of data analytics, refers to specific actions.
To explain this confusion—and attempt to clear it up—we’ll look at both terms, examples, and tools.
What is data analytics?
Data analytics is a broad term that defines the concept and practice (or, perhaps science and art) of all activities related to data. The primary goal is for data experts, including data scientists, engineers, and analysts, to make it easy for the rest of the business to access and understand these findings.
Data that sits raw, as-is, has no value. Instead, it’s what you do with that data that provides value. Data analytics includes all the steps you take, both human- and machine-enabled, to discover, interpret, visualize, and tell the story of patterns in your data in order to drive business strategy and outcomes.
A successful data analytics practice can—should—provide a better strategy for where your business can go. When done well, data analytics can help you:
- Find trends
- Uncover opportunities
- Predict actions, triggers, or events
- Make decisions
Like any true practice, data analytics is systematic, consisting of many computational and management steps. Experts stress the word “systematic”. Being systematic is vital because data analytics uses many different activities and draws on all types and sizes of data sources.
Many subject areas comprise data analytics, including data science, machine learning, and applied statistics. One tangible result of a data analytics practice is likely well-planned reports that use data visualization to tell the story of the most salient points so that the rest of the business—who aren’t data experts—can understand, develop, and adapt their strategies.
Think of the many ways data analytics can highlight areas of opportunity for your business:
- Using facts, not guesses, to understand how your customers engage might mean you change your sales or marketing processes. A bakery might use its data to realize its demand for bread bowls increases in the winter—which means you don’t need to discount the prices when demand is high.
- An increase in cyberattacks might mean you need to take proactive preventative measures.
- Data from a variety of IoT devices in a certain environment, such as your server room, a power station, or a warehouse, could indicate whether you’re providing the safety and reliability you need at the lowest cost possible.
Processes in data analytics
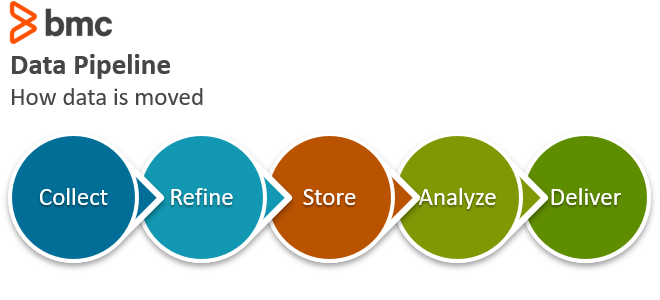
The data analytics practice encompasses many separate processes, which can comprise a data pipeline:
- Collecting and ingesting the data
- Categorizing the data into structured/unstructured forms, which might also define next actions
- Managing the data, usually in databases, data lakes, and/or data warehouses
- Storing the data in hot, warm, or cold storage
- Performing ETL (extract, transform, load)
- Analyzing the data to extract patterns, trends, and insights
- Sharing the data to business users or consumers, often in a dashboard or via specific storage
What is data analysis?
Consider data analysis one slice of the data analytics pie. Data analysis consists of cleaning, transforming, modeling, and questioning data to find useful information. (It’s generally agreed that other slices are other activities, from collection to storage to visualization.)
The act of data analysis is usually limited to a single, already prepared dataset. You’ll inspect, arrange, and question the data. Today, in the 2020s, a software or “machine” usually does a first round of analysis, often directly in one of your databases or tools. But this is augmented by a human who investigates and interrogates the data with more context.
When you’re done analyzing a dataset, you’ll turn to other data analytics activities to:
- Give others access to the data
- Present the data (ideally with data visualization or storytelling)
- Suggest actions to take based on the data
A vital point of data analysis is that the analysis already captures data, meaning data from the past.
Type of data analysis
There are many types of data analysis techniques. Here are the most well-known:
- Text analysis. This is also referred to as Data Mining. This method discovers a pattern in large form data sets using databases or other data mining tools.
- Statistical analysis. This analysis answers “What happened?” by utilizing past data in dashboard form. Statistic analysis involves the collection, analysis, interpretation, presentation, and modeling of data.
- Diagnostic analysis. This analysis answers “Why did it happen?” by seeking the cause from the insights discovered during statistical analysis. This type of analysis is beneficial for identifying behavior patterns of data.
- Predictive analysis. This analysis suggests what is likely to happen by utilizing previous data. The predictive analysis makes predictions about future outcomes based on the data.
- Prescriptive analysis. This type of analysis combines the insights from text, statistical, diagnostic, and predictive analysis to determine the action(s) to take in order to solve a current problem or influence a decision.
Combine these different methods depending on the business need and decision-making process. Pieter Van Iperen, Managing Partner of PWV Consultants, uses the example of web traffic, which your company very likely tracks. You have tools in place to automatically collect and measure individual metrics within web traffic, such as:
- Location
- Activity per time of day
- Mobile vs PC
- Browsers in use
Each of those data points is a small part of the overall analysis. Then, humans perform further analysis to determine things like how to optimize your website to:
- Improve sales opportunities
- Reduce sales lead time
- Increase revenue
Analysis that is repeatable can often be converted into a new metric within your analytic platform.
Which is better?
Brack Nelson, Marketing Manager at Incrementors SEO Services, suggests that the outcome of data analytics is more encompassing and beneficial than the output of data analysis alone.
Consider the differences between:
- An analyst sending a business user a spreadsheet of numbers versus creating a dashboard for the user to interact with descriptive analytics.
- A business user receiving a report with the live value of a marketing campaign versus creating a web app that both shows the forecast and lets the user interact with predictive analytics.
The ultimate move, Brack says, is creating a product that makes a data-driven prediction and contacts another system’s API is order to produce action—that’s data analytics in action.
Tools for data analytics
Analytics software are tools that help humans and machines perform the analysis that allows us to make mission-critical business decisions.
Common tools for performing data analysis and overall analytics include:
- Microsoft Excel
- Microsoft Power BI
- Tableau
- R analytics
- Python
- Google Analytics
(Check out BMC Guides for tutorials on many big data and data visualization tools.)
Why the confusion?
Interestingly, the terms are sometimes confused by data scientists and data analysts themselves!
Polling a variety of people in the wide world of data revealed this divide. Most agreed that data analytics is the broader field, of which data analysis is one key function, but others had different takes. This lack of clarity underscores that maybe the question isn’t data analytics versus data analysis—but whether you’re doing both as well as you can.
Several people said that they aren’t concerned if us non-data experts use the terms interchangeably. So, if you confuse data analytics with analysis at your next meeting, most folks will be none the wiser.