
In a perfect world, computers would function properly on the network at all times. There would be no issues with the operating system and no problems with the applications. Unfortunately, this isn’t a perfect world. System failures can and will occur, and when they do, it is the responsibility of system administrators to diagnose and resolve the issues. But where can system administrators begin the search for solutions when problems arise? The answer is Windows event logs.
What are Windows event logs?
At their core, Windows event logs are records of events that have occurred on a computer running the Windows operating system. These records contain information regarding actions that have taken place on the installed applications, the computer, and the system itself. Windows event logs include both actions taken by users and by processes executing on the computer. If there is an issue with the system, they can provide an administrator with crucial context for reaching a resolution.
Imagine for a moment that an application on your Windows machine fails, and you’re presented with an obscure error message that is relatively useless for identifying the cause of the problem. This is an example of an instance where the Windows event logs can be of great use. Event log files consist of log information that can help organizations reduce their exposure against malware, intruders, damages, and legal obligations.
The Event logs are listed with header information consisting of date and time, user, computer, event ID, source, and type. Type is used to identify the severity of the event. They are Information, Warning, Error, Success Audit (Security Log), and Failure Audit (Security Log).In general, Windows-based systems produce the following log types:
- System: Logs regarding incidents on Windows-specific systems such as outdated hardware drivers.
- Application: Logs regarding the installation of new software or hardware or currently running software.
- Security: Logs regarding a Windows system’s audit policies, login attempts, and resource access.
Using BMC Helix Log Analytics
To monitor windows event logs, they need to be gathered, stored, monitored and managed by enterprises. This can be quite a tiresome job as log files come in various formats from different sources and in large numbers. Your network devices and servers produce thousands of system event log entries every day. Approximately 95% of your log files record entries of all events or transactions taking place in your system, such as user logins and server crashes. A manual check on every Windows device is tedious and impossible and warrants automated auditing and monitoring of event logs on a regular basis. Further, securing the information on your network is critical to your business to protect against attempted or successful unauthorized access.
This is where the log management solution from BMC helps, by providing a centralized and easy-to-navigate user interface to collect, parse, analyze, and visualize Windows event logs end to end and generate alerts. BMC Helix Log Analytics helps you audit, monitor, and report authorized and unauthorized file access, policy changes, and any activity involving a breach of personal information such as financial data, employee details, or patient records by monitoring these event logs.
Collecting logs
The following high-level diagram shows how Windows event logs are collected and processed for analysis using BMC Helix Log Analytics.
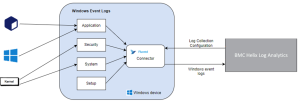
Figure 1. Collecting Windows event logs into BMC Helix Log Analytics.
You simply need to configure a windows event log collection policy to collect logs from remote or local windows event source via log connectors.
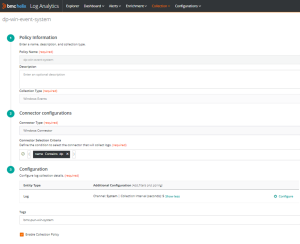
Figure 2. Log collection policy for windows event logs.
You can specify the channels and collection time interval to collect logs. Collection policy provides an out-of-box parser which parses these event log records without you writing complex regular expressions.
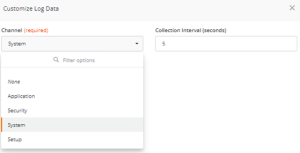
Figure 3. Configuring windows event logs.
Analyzing logs
Once logs are collected, processed and stored, you can use log explorer to search and analyze logs. You can query the logs, put filters and see time-based count of log distribution.
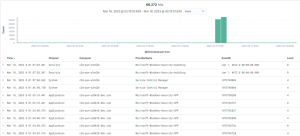
Figure 4. Analysing logs in Explorer.
Further you can click on any log record to slice and dice further for more meaningful information for your operations or troubleshooting needs.
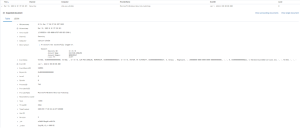
Figure 5. Detailed analysis of windows event log record.
By setting up thresholds via log alerts policy, you’ll be alerted if any of the user-defined events is logged and/or if the number of error events (events with “Error” or “Critical” severity levels) equals or exceeds the set value. Further, when you can correlate log events in context of a Service Monitoring powered by BMC Helix AIOps, it makes troubleshooting easy and gets to the root cause faster and allows ITOps team to take proactive actions.
Visualizing logs
BMC Helix Log Analytics provides an out of box windows event logs dashboard which helps to visualize different attributes and their log distribution to analyze windows event logs. You can also create a custom dashboard and add other meaningful visualizations of interest. This helps to speed up the process of investigating unusual occurrences and quickly determine whether they’re a sign of a real problem.
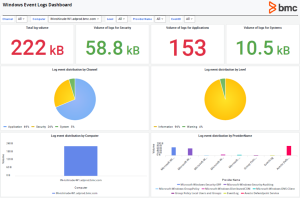
Figure 6. Out of box dashboard for windows event logs monitoring.
BMC Helix Log Analytics is a centralized event log management platform for collecting and monitoring your Windows event logs for easier log analysis and issue investigation. It provides a detailed analysis of events in your infrastructure and log alerts keep you updated with potential threats and issues in your network so you can proactively troubleshoot problems instead of waiting for them to occur. This enables higher availability and reliability for your network, reduces downtime, and increases revenue. To learn more, refer product documentation.