The primary responsibility of DevOps teams is to ensure applications are fast, available, and reliable. When an application slows down, or stops altogether, DevOps needs to be able to diagnose the problem and restore normal operation quickly and efficiently. This requires data from every layer of the application, including:
- Performance metrics
- Events
- Logs
- Application topology
BMC Helix Operations Management with AIOps (artificial intelligence for IT operations) can consume all these data types, however, in this article, we will focus on metrics and logs and how it uses them to help you diagnose application problems quickly and efficiently.
Metrics
Metrics are the vital signs that tell you how your devices and applications are performing and how well they are coping with the workload. In BMC Helix Operations Management with AIOps, metrics come either from our own monitoring agent or our metrics API. The agent focuses mainly on monitoring IT infrastructure such as servers, Amazon Elastic Compute Cloud (EC2) instances, databases, and containers, either on premises or in the cloud. The metrics API allows BMC Helix Operations Management with AIOps to take in data from other sources, such as application performance monitors like Dynatrace or New Relic, and metric collectors like StatsD and Prometheus.
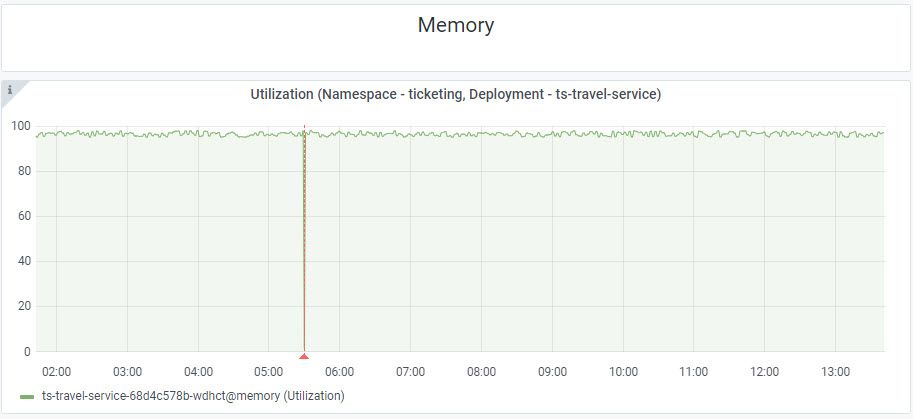
The BMC Helix dashboards graph above is tracking memory utilization for a Kubernetes pod supporting the ts-travel-service. This deployment is a key part of our Corporate Travel application. We can see from the graph that memory utilization is very high, almost 100 percent. This is not necessarily a problem, but we need to keep an eye on it. Luckily, BMC Helix Operations Management with AIOps provides a way to do this intelligently using machine learning (ML).
Anomaly Detection vs. Thresholds
The traditional way of detecting problems is to set thresholds in monitoring tools. The difficulty with thresholds is that they can generate a lot of noise. Just because a node is running at 95 percent CPU utilization does not necessarily indicate a problem. Wouldn’t it be helpful to know whether it’s normal for the CPU to be running that hot? That’s where BMC Helix Operations Management with AIOps’s ability to detect anomalous behavior comes in. Anomaly detection uses ML techniques to model the normal behavior of a metric and alert you when it departs from its normal pattern.
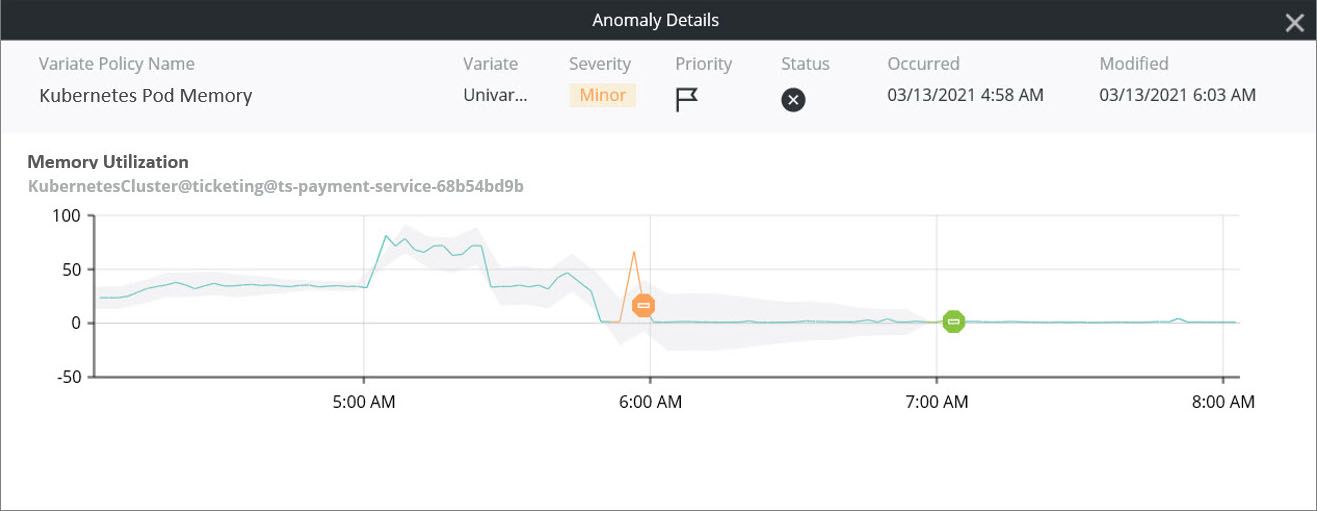
Here we have detected a spike in memory utilization for a Kubernetes pod. We noted it as an anomaly because it has deviated from its normal pattern. On its own, this may tell us nothing more than there was a transient increase in memory consumption on the pod. If it happens again, or we start seeing anomalies on other key load indicators, then it could be a sign that either the pod is overloaded, or the application is not using resources efficiently.
Logs
As with metrics, the challenge with logs is that there are a lot of them, and they contain vast amounts of data. They are essential to troubleshooting application problems, but manually scrolling through logs looking for errors can be like searching for a needle in a haystack. BMC Helix Operations Management with AIOps streamlines this process by consolidating your logs into a single location, scanning them for errors, and notifying you when it finds them.
BMC Helix Log Analytics is based on the industry-standard ELK (Elasticsearch, Logstash, and Kibana) stack, which means you may already be familiar with one or more of its components. We provide you with multiple ways to get your log data into BMC Helix Log Analytics. You can use standard shipping and parsing components like Logstash and Filebeat, or you can push log messages directly to our log API.
Presenting the Data
Dashboards organize and present data in a way that makes it easier for DevOps to consume. Rather than focusing on individual devices and software components, dashboards can aggregate the data at the application and service level and yet still provide a way to drill down to those lower-level components. Our example dashboard (below) rolls up key performance indicators for the Kubernetes cluster hosting the Corporate Travel service. Performance indicators from pods and namespaces are presented alongside a service level agreement (SLA) status indicator and a breakdown by severity of current outstanding alerts. It’s clear from this dashboard view that, although there are no major problems with the Corporate Travel service, we have several pods that are consuming significantly higher memory and CPU than the others.
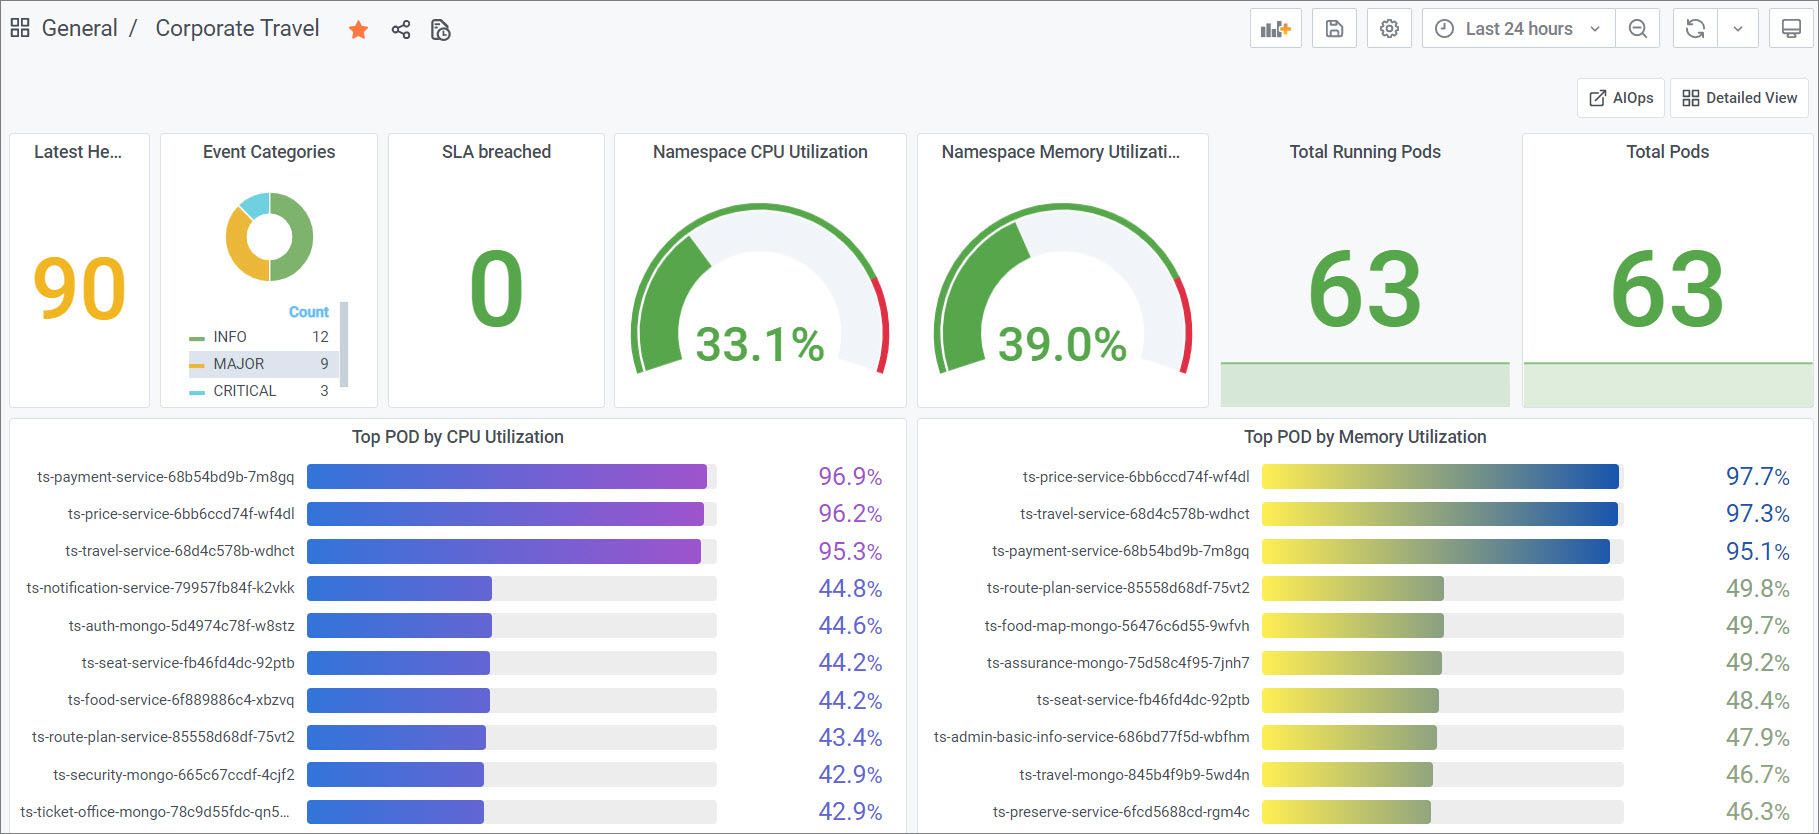
If we scroll down the dashboard, we can see other kinds of data, including application logs:

The dashboard allows you to view the most recent log data in the context of the Corporate Travel service. However, if more detailed troubleshooting is necessary, one click will take you to the BMC Helix Log Analytics Discover interface, where you can build intuitive searches using the Kibana Query Language (KQL):

Here we are searching for log messages at the ERROR and WARN levels. The results are displayed and highlighted, as seen below.
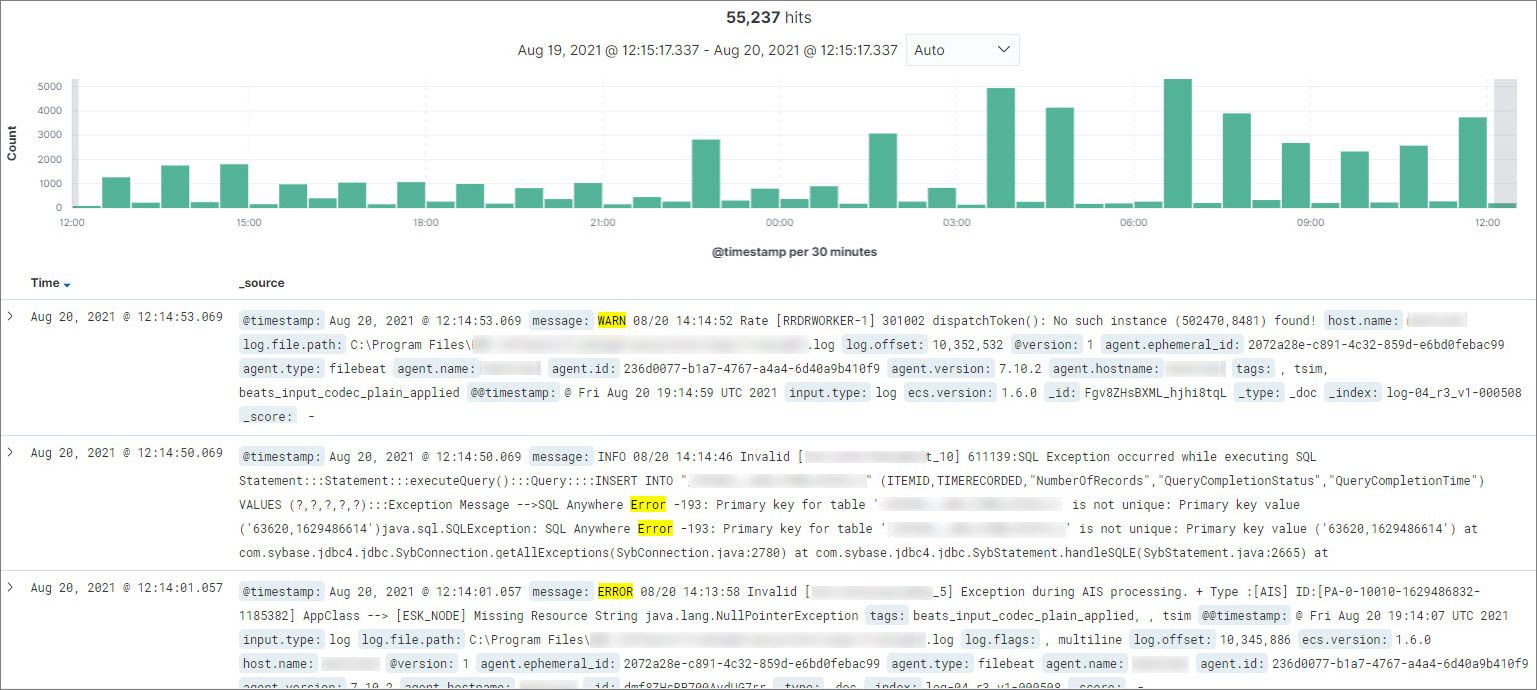
Of course, it is better to detect errors before they impact service, which is why BMC Helix Log Analytics allows you to run saved searches against your log data continuously and forward the matching log records to BMC Helix Operations Management with AIOps as events.
Getting to the Root Cause
As I said at the outset, the goal of DevOps is to diagnose the problem as quickly as possible so that normal service can be restored. BMC Helix Operations Management with AIOps expedites this process by applying machine intelligence to it.
We know we have a problem with the Corporate Travel service. It’s up, but it’s not 100 percent healthy:
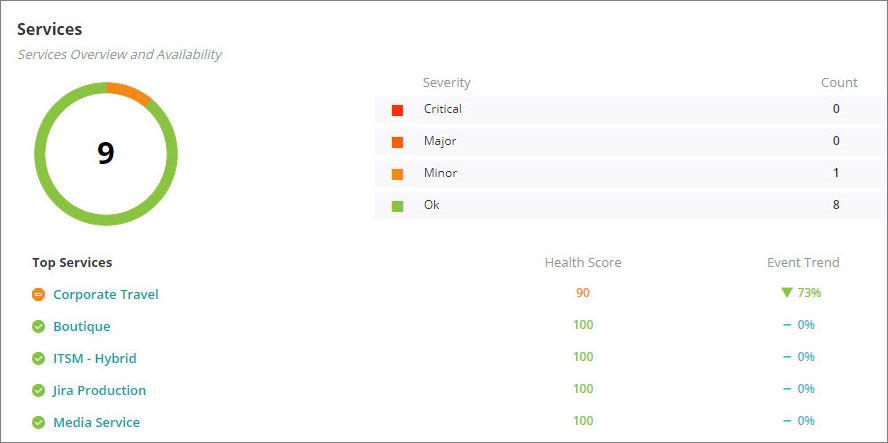
From this Services summary page, we can launch a probable cause analysis (PCA) that will help us isolate the components of Corporate Travel that are impacting its health.
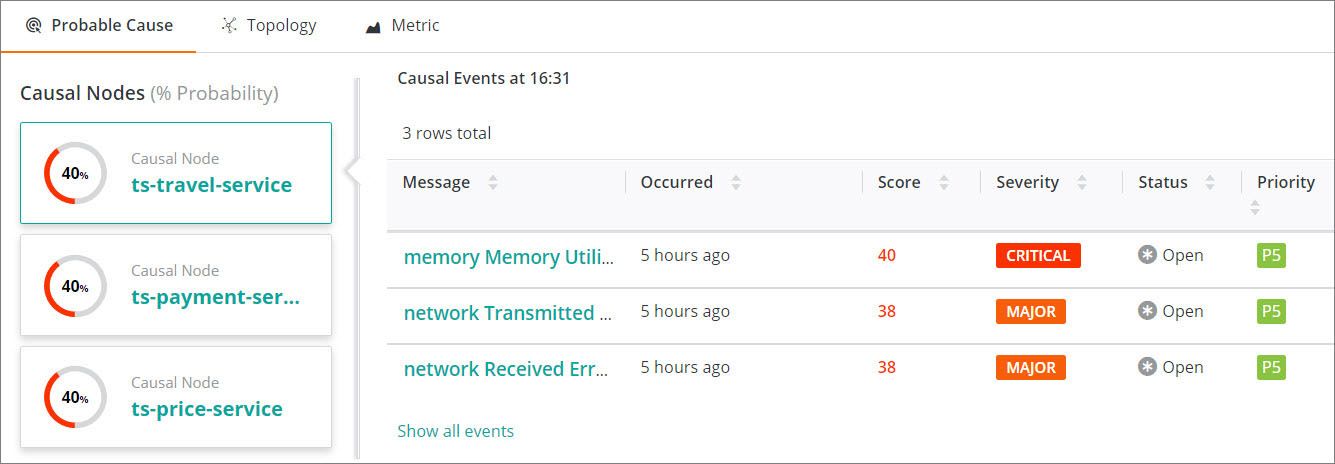
PCA considers the service topology and isolates the nodes that are the most likely causes of the reduced health score. The topology data may have come from an application performance management (APM) tool, a configuration management database (CMDB), or BMC Helix Discovery. Regardless of its source, it’s invaluable input into PCA.
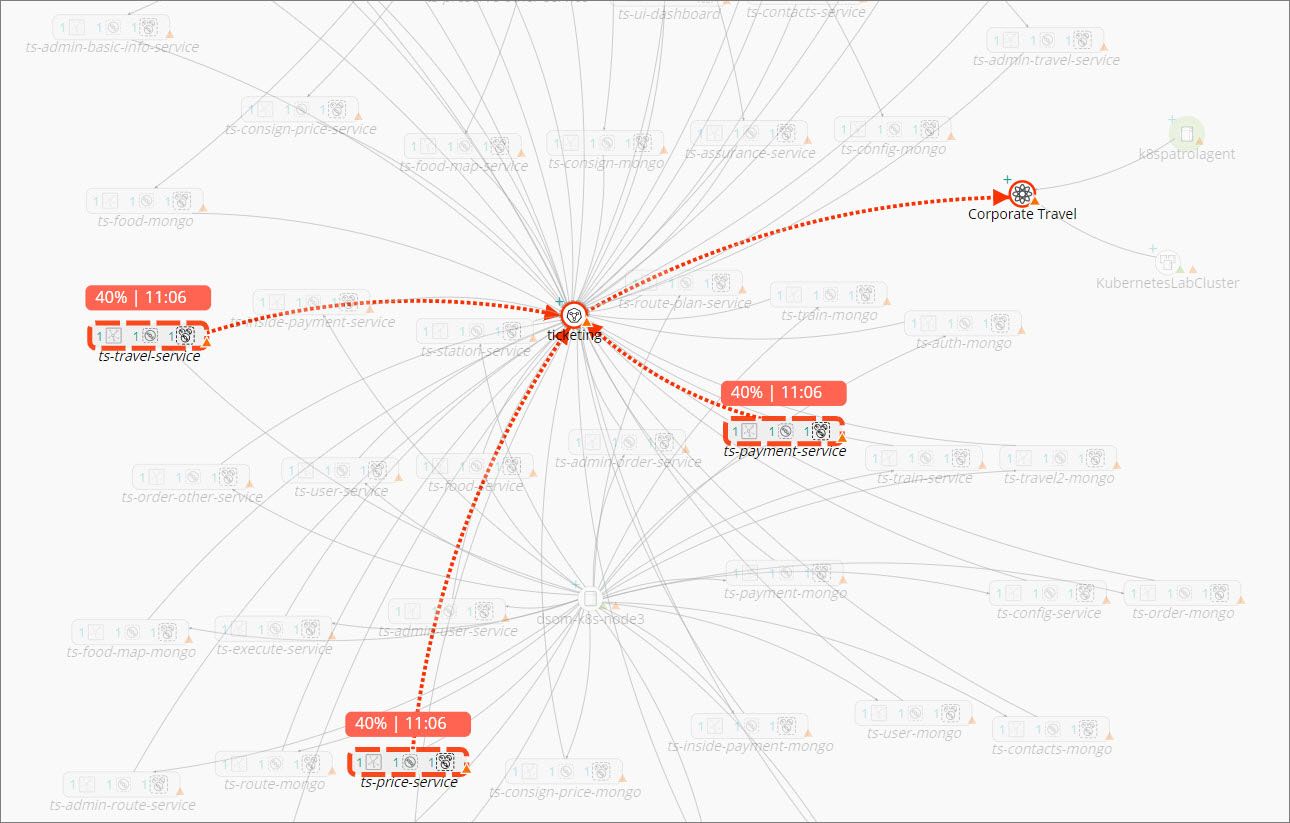
Having isolated the top causal nodes, PCA looks at the events impacting those nodes and assigns them a score based on several factors:
- The severity of the event
- Whether the metric that generated the event is a key performance indicator (KPI)
- The number of services impacted
- The depth of the causal node in the service model—the deeper the node, the more likely it is to be a cause, rather than a symptom
- The proximity in time of the causal event to the time the service impact was detected
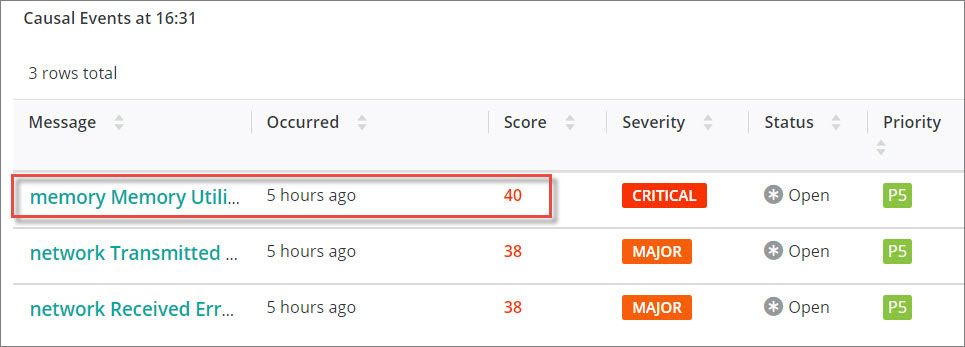
These factors are weighted and used to calculate a percentage probability score, which is then used to rank the causal events. In our Corporate Travel service, we have identified three pods as the source of the reduced health score, and very high memory utilization as the most probable cause:
Summary
BMC Helix Operations Management with AIOps allowed us to quickly identify the probable root cause of an issue with our Corporate Travel application by applying ML and other AI techniques to metrics, events, and log data. We also saw that application and service topology data is a vital input into PCA. The key benefit of this acceleration of the diagnostic process is that it allows us to fix the problem faster, thereby reducing mean time to repair (MTTR).
With BMC Helix dashboards, we saw how the health of a complex, modern application like our Corporate Travel service can be represented in a way that makes sense to DevOps users. The dashboard provided a top-down view of the service, while still allowing users to drill down into the IT infrastructure or cross-launch into BMC Helix Log Analytics for further troubleshooting.
For more information on how AIOps can turn your monitoring metrics and log data to gold, please visit BMC Helix Operations Management with AIOps.
These postings are my own and do not necessarily represent BMC's position, strategies, or opinion.
See an error or have a suggestion? Please let us know by emailing [email protected].


