A stack is any collection of software products that are designed to work together, such as the popular LAMP stack, comprised of Linux, Apache, MySQL, and PHP. The ELK stack includes ElasticSearch, LogStash, and Kibana.
ELK is one of the most widely used stacks for processing log files and storing them as JSON documents. It is extremely configurable, versable, and scalable. It can be simple to use or complex, as it supports both simple and advanced operations.
(This article is part of our ElasticSearch Guide. Use the right-hand menu to navigate.)
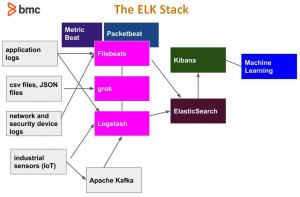
ELK is best understood by looking at the pieces in the following diagram.

Going left to right and top to bottom we have the following components:
- Logs, sensor output, and application files. This list illustrates how ElasticSearch can be used to store all kinds of data. It can be used for cybersecurity or system monitoring. It can store application data of any kind. This is because it’s a JSON database, much like MongoDB, which is designed to store any kind of information, since JSON has no rules with regards to structure. ElasticSearch scales to enormous volumes, too, so you could use it to capture sensor data from industrial devices and all types of machinery and other IoT (Internet of Things) device output and keep adding clusters and nodes to scale the system.
- Apache Kafka. This can be put in front of ElasticSearch to store streaming data, providing a buffering and queuing mechanism.
- Filebeat, Packetbeat, Metricbeat. You can program ElasticSearch yourself, using regular expressions or writing parsers in any language. Or you can use any of the Beats packages, which are pre-programmed to work with most common file types. Beats can send the data directly to ElasticSearch or to Logstash for further processing, which then hands it off to ElasticSearch.
- Grok. One of the many ElasticSearch plugins, grok makes parsing log files easier by providing a programming language that is simpler than using regular expressions, which are notoriously difficult. Geoip is another plugin, which maps IP addresses to longitude and latitude and looks up the city and county name by consulting its database.
- Logstash. You can use Logstash to work with log files directly or you can process them with any of the Beats first. For web server logs, Filebeat has an nginx module and modules for Apache. But, it does not parse the message fields into individual fields; Logstash does that. So, you could use one or both. For custom logs, for which you would have to write your own parser, you should use Logstash and grok.
- ElasticSearch. The database ElasticSearch stores documents in JSON format. They are stored with an index and document type as well as a document id. They can be simple JSON or nested JSON documents.
- Machine learning. ElasticSearch has added some machine learning capabilities to its product. For example, an Anomaly Detection plugin flags events in a time series log, such as a network router log, to identity those that are statistically significant and should be investigated. In terms of cybersecurity, this could indicate a hacking event. For a financial system this could indicate fraud.
- Kibana. This is a graphical frontend for ElasticSearch. You might prefer to work with ElasticSearch using curl and JSON queries, or you can use the graphical Kibana interface, which makes browsing and querying data easier. This also lets you can dashboards and charts targeted for different audiences. So, you could have one set of dashboards for the cybersecurity team, another for the performance monitoring team, and another for the ecommerce team.
Indexes and Document Types
Each ElasticSearch document is stored under an index and document type, which is given in the URL. For example, the document below is index/type /network/_doc. Each document requires a unique identifier which is the _id field.
Below is a sample web server log JSON document.
"_index" : "network",
"_type" : "_doc",
"_id" : "dmx9emwB7Q7sfK_2g0Zo",
"_score" : 1.0,
"_source" : {
"record_id" : "72552",
"duration" : "0",
"src_bytes" : "297",
"host" : "paris",
"message" : "72552,0,297,9317",
"@version" : "1",
"@timestamp" : "2019-08-10T07:45:41.642Z",
"dest_bytes" : "9317",
"path" : "/home/ubuntu/Documents/esearch/conn250K.csv"
}
ElasticSearch Schemas
ElasticSearch is a noSQL database, which means it does not require a schema. So, ElasticSearch will take a JSON document and automatically set up an index mapping.
Index mapping is advantageous, but sometimes you need to nudge it in the right direction because you may not always want an automatically created index map. With especially complicated nested JSON documents or documents with an array of other JSON documents, ElasticSearch might flatten fields that you want to set up and arrays. That could lead to misleading or incorrect query results. So, you can set this mapping up yourself, which we explain in several articles within this guide (see navigation on the right side).
Kibana
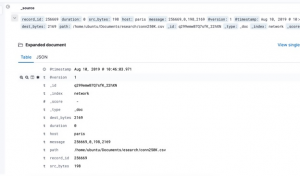
Kibana lets you query documents using an easy-to-understand Lucene query language. This is opposed to using the more complex, more powerful DSL syntax written in JSON, which typically uses curl. For example, just type the word water in Kibana and any document that contains the word water will be listed.
The image below shows one document in Kibana.

Querying ElasticSearch
You can query ElasticSearch using Kibana, by writing JSON queries, or by passing queries as command line arguments. The most common way to query ElasticSearch is to use curl. For example, here are some queries:
| List all indexes | curl -X GET ‘http://localhost:9200/_cat/indices?v’ |
| query by passing parameters | curl -X GET http://localhost:9200/samples/_search?q=school:Harvard |
| query by writing queries arguments as a JSON | curl -XGET –header ‘Content-Type: application/json’ http://localhost:9200/samples/_search -d ‘{ “query” : { “match” : { “school”: “Harvard” } } }’
|
Writing Data to ElasticSearch
You write document using curl as well. Here, we are writing document _id = 1 index = samples and type = _doc.
LogStash
To get an understanding of how to work with Filebeats and Logstash, here is a sample Logstash config file. This one parses a csv file and writes it to the ElasticSearch server at IP address and port paris:9200.
input {
file {
path => "/home/ubuntu/Documents/esearch/conn250K.csv"
start_position => "beginning"
}
}
filter {
csv {
columns => [ "record_id", "duration", "src_bytes", "dest_bytes" ]
}
}
output {
elasticsearch {
hosts => ["parisx:9200"]
index => "network"
}
}
These postings are my own and do not necessarily represent BMC's position, strategies, or opinion.
See an error or have a suggestion? Please let us know by emailing [email protected].


