
Logs play a key role in understanding a system’s performance and health, helping IT operations (ITOps) teams and site reliability engineers (SREs) identify issues as they emerge and quickly track down the cause of failures. Log analytics involves deriving meaningful insights from log data, which then feeds into observability.
With DevOps and multicloud adoption, logging has become harder than ever. Architecture has evolved into microservices, containers, and orchestration infrastructure deployed across public and private clouds or in hybrid environments. Not only that, the sheer volume of data generated by these environments is constantly growing, which constitutes a challenge in itself. Long gone are the days when an engineer could simply use a Secure Shell (SSH) to log into a machine and grep a log file. This cannot be done in environments that have hundreds of containers generating terabytes of log data a day.
The advanced log management and analytics capabilities of BMC Helix Log Analytics can help by allowing DevOps, ITOps, or SREs gain the visibility they need and ensure applications are always available and performing optimally.
BMC Helix Log Analytics is part of the BMC Helix Operations Management with AIOps solution, which is built on a microservices-based architecture and available as software as a service (SaaS) on the BMC Helix platform, integrated with other services for a seamless and unified experience, and as a container-based, on-premises deployment. It provides the following key capabilities: –
- Log collection
- Log enrichment
- Field extraction
- Log analysis
- Alerts and events
- Root cause isolation with AIOps
- Data visualization
- Archive and restore
Log collection
BMC Helix Log Analytics provides log collection polices to ingest logs from different data sources or applications by leveraging open-source log connectors. It provides centralized connector management for a unified view of connectors across a distributed environment and tracks their health. Out-of-the-box log collection is available for public cloud (Amazon Web Services (AWS)), Kubernetes, Apache, syslogs, Windows event logs, and different application log files.
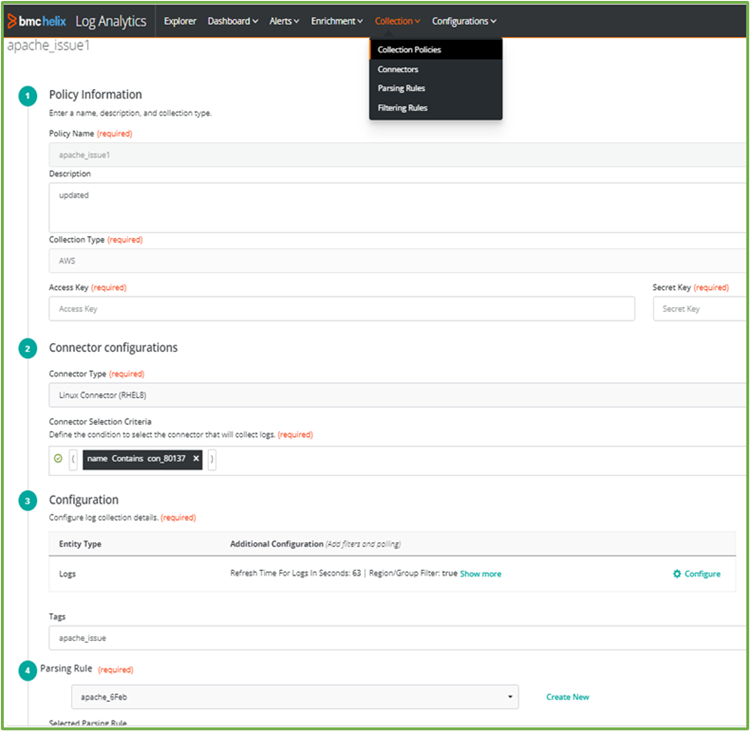
Figure 1. Log collection policy to collect logs.
Log enrichment
For an ITOps or DevOps engineer troubleshooting issues with logs, problem analysis can be difficult due to the lack of relevant context, which leads to an increase in the mean time to repair (MTTR). For example, if you are attempting to search the logs by a vulnerable host’s name, you may not be able to do so if the logs contain only IP addresses but no hostnames. It becomes almost impossible to reconstruct a situation because the volatile, dynamic IP data may change every hour, day, or week, leading to incorrect and misleading summary and detail information.
Log enrichment adds meaningful context to logs for enhanced observability and diagnosis. You can enrich logs by connecting to multiple different enrichment sources like DNS, LDAP, GeoIP, and CSV.
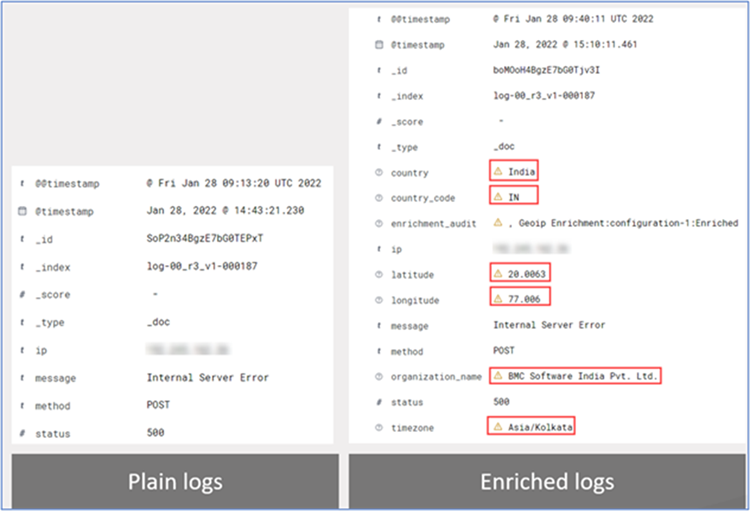
Figure 2. Logs before and after enrichment.
Field Extraction
Often, we get messages in our logs which contain a lot of useful information but are not easily readable. BMC Helix Log Analytics provides field extraction to allow you to tokenize and extract relevant fields from log messages at the time logs are ingested.
Extracted fields are then used in the log explorer to search, filter, and query logs. They can also be used with different alert or enrichment polices; to create visualizations and add them to the dashboard; and for other advanced diagnostics and troubleshooting.
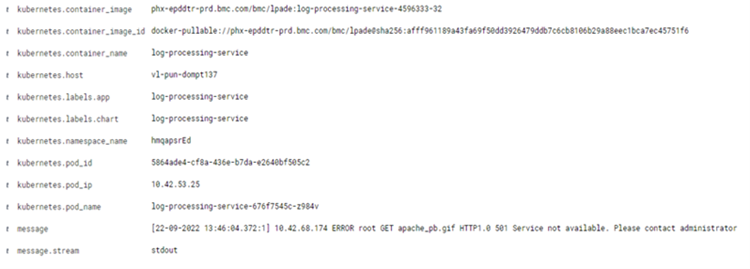
Figure 3. Log record before field extraction.
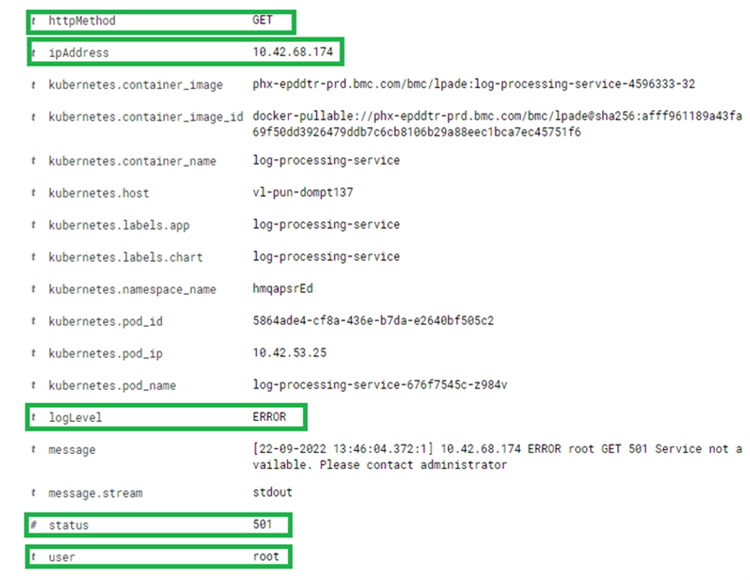
Figure 4. Log record with field extraction.
Log analysis
The log explorer helps you discover and gain quick insights into your data by searching and filtering it to get information about the structure of the fields or for a given point in time. It can also create a visualization or save searches and present the findings in a dashboard.
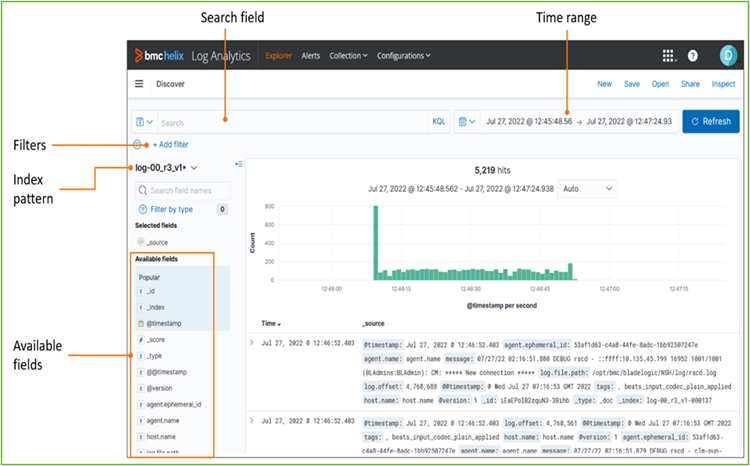
Figure 5. Discover and search logs in log explorer.
Alerts and events
Alerts can detect issues quickly without you having to continuously monitor the dashboard. Alerts can be created for complex occurrences between many applications, which allows the ITOps team to take proactive action for the specific, tangible events that are generated.
You can also create an alert by using alert policies and defining the thresholds on the given fields and error conditions.
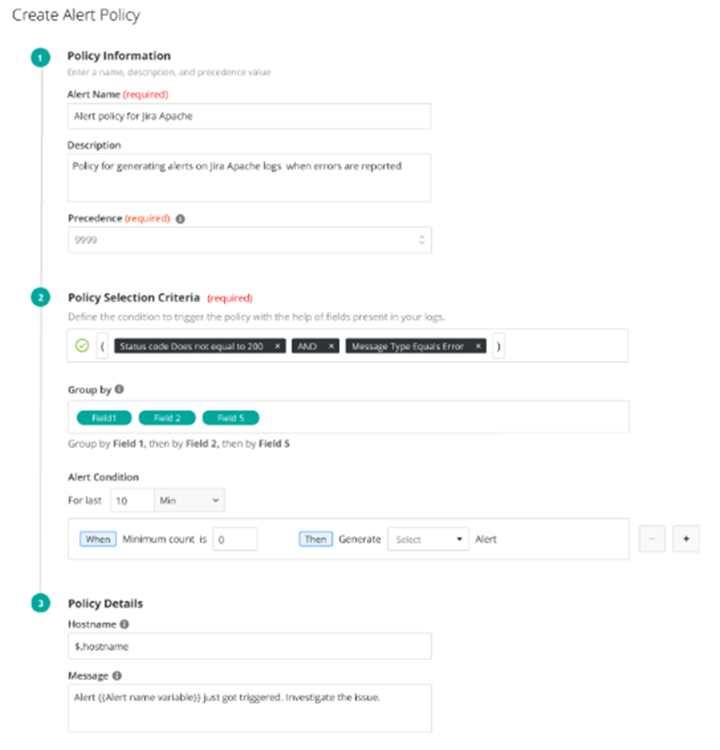
Figure 6. Alert-configuration.
While managing and analyzing log events, users can perform multiple actions, including notifying the end user via email. All log events are operated in the BMC Helix Operations Management portal and a user can cross-launch into BMC Helix Log Analytics to see the associated logs corresponding to that log event.
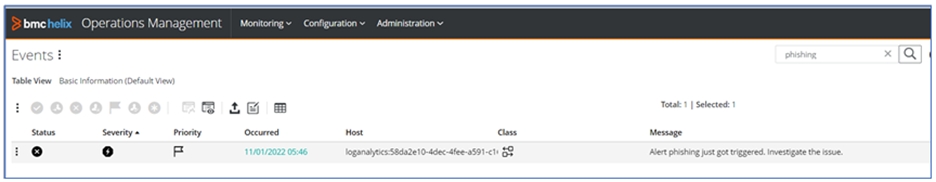
Figure 7. Analysing Log events in BHOM.
Root Cause Isolation with AIOps
If you are using BMC Helix Service Monitoring, then a log event get auto correlated with other contextual events for a service to provide root cause isolation and pinpoint the causal node. You can then click on the log event and cross-launch into BMC Helix Log Analytics to see the associated contextual logs and diagnose the issue.
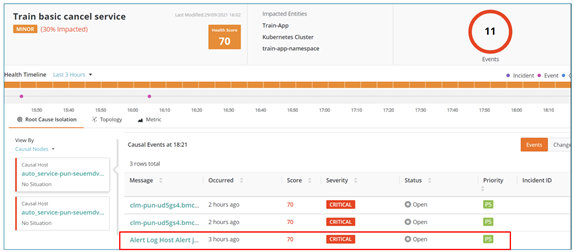
Figure 8. Root Cause Isolation using log events.
Log events are also part of Situations formed on the Services, and if it is the root cause event, you can click on it to see associated logs.
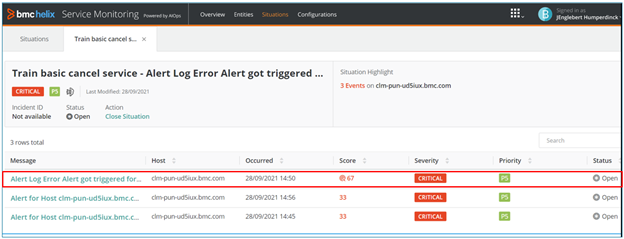
Figure 9. Situations using log events.
Data visualization
You can represent log data graphically by using BMC Helix dashboards to derive valuable insights, analyze issues, and identify trends. All data is stored centrally, so it can be plotted across multiple sources to run cross-analyses and identify correlations. There are many out-of-the-box dashboards available for log monitoring like AWS, Kubernetes, syslog, Windows event logs, and more. Users can also create a custom dashboard by adding visualizations of interest.
BMC Helix dashboards provide various options to run queries and apply filters to dashboards so users can interrogate their data. You can also drill down from the dashboard to specific data points to speed up the process of investigating unusual occurrences and quickly determine whether they’re a sign of a real problem.
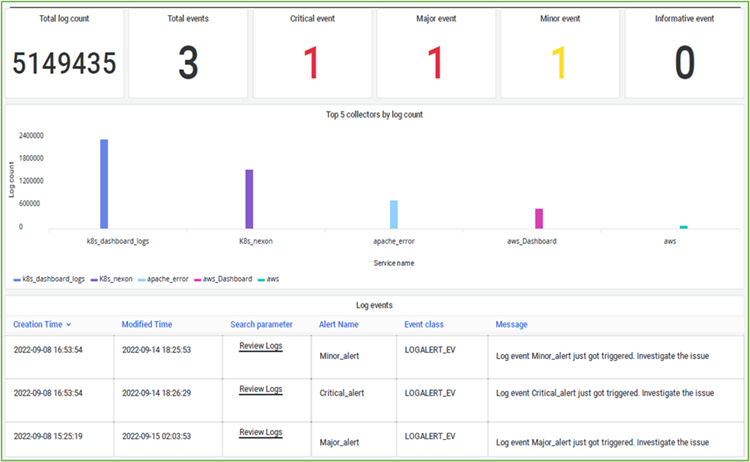
Figure 10. Monitoring using logs dashboard.
Archive and Restore
BMC Helix Log Analytics provides real-time storage and access for 30 days of raw log data; cold storage to retain logs for longer durations; and an option to restore data on demand for search and analysis. The archival option enables critical logs to be retained for even greater durations, which may be useful for audit, complaints, and other operational requirements.
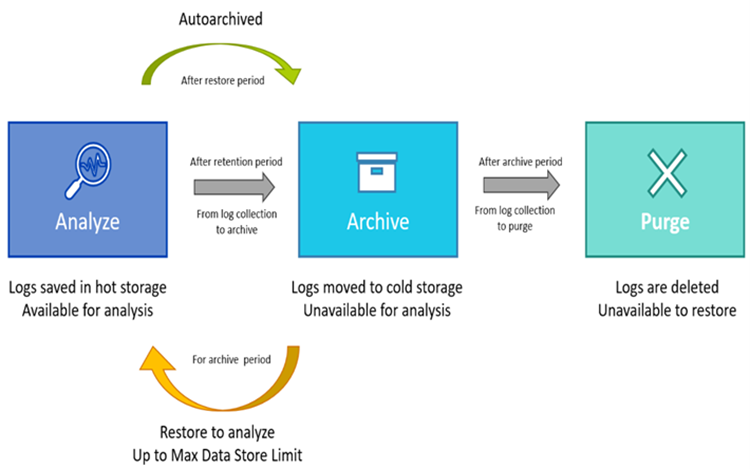
Figure 11. Log archive and restore.
To conclude, BMC Helix Log Analytics provides a wealth of insights into the usage, health, and performance of your systems, together with a powerful and efficient set of integrated capabilities for detecting and troubleshooting issues. Not only does it simplify and accelerate the process of collating, normalizing, and parsing your log data to make it available for analysis, but it also provides advanced artificial intelligence and machine learning (AI/ML) capabilities for noise reduction and root cause isolation with BMC Helix Service Monitoring powered by AIOps.
BMC Helix Log Analytics leverages ML to keep pace with your systems and data as they evolve and ensures that you get the maximum value from your logs. This in turn helps to free up your ITOps and SRE teams to focus on investigating true positives and making targeted improvements to their platform and infrastructure.
To learn more about BMC Helix and BMC Helix Log Analytics capabilities, watch our overview video here or visit www.bmc.com/helix or our documentation site.