
Application containerization has become the norm in the IT industry. The growing adoption of microservices and distributed applications gave rise to the container revolution, necessitated orchestration tooling, like Kubernetes, which helps manage the lifecycle of hundreds of containers deployed in pods. It is highly distributed, with dynamic parts, and involves several systems with clusters and nodes that host hundreds of containers that are constantly being spun up and destroyed based on workloads.
When dealing with a large pool of containerized applications and workloads, it is important to be proactive with Kubernetes monitoring and debugging errors at the container, node, or cluster level and have an observability strategy to keep track of all the dynamic components. Such a strategy allows you to see whether your system is operating as expected, and to be alerted when it isn’t. You can then drill down for troubleshooting and incident investigation, and view trends over time. Kubernetes can also simplify the management of your containerized applications and services across different cloud services, but it does add complexity by introducing new layers and abstractions, which translates to more components and services that need to be monitored. This makes Kubernetes observability even more critical.
We already provide the ability to collect metrics from Kubernetes and monitoring with BMC Helix Operations Management. In this blog post, we will focus on Kubernetes observability with logs using BMC Helix Log Analytics. The Kubernetes logging mechanism is a crucial element to manage and monitor services and infrastructure. It allows you to track errors, monitor the health of containers that host applications, and even fine-tune the performance of containers.
Why Kubernetes logging is difficult
Application logs are a great help in understanding what’s happening inside the application. They are also handy for debugging and monitoring cluster activity. Let’s look at some of the most common challenges in Kubernetes log monitoring.
Namespace logging
When all your workloads run in shared-worker virtual machines (VMs), each one that belongs to different projects is divided by namespaces. Because different projects might have their own unique logging preferences, there needs to be a new way to configure these without compromising on security.
Support logging service level agreement (SLAs)
There’s only one pod per Kubernetes worker node, and if this pod is rescheduled, it influences all the other pods in the worker node. This presents a challenge. Each node can run up to 100 pods, so you need to find a way to make sure your log monitoring solution can collect logs from all these pods. This frequently creates a noisy environment. One error might lead to more errors in the same worker node.
Layered logging
Kubernetes consists of clusters that have multiple layers like pods, nodes, and namespaces, etc., that require monitoring. And each of them produces different types of logs, each with different characteristics and priorities. You might also find different SLAs for the same layer. One can only imagine what happens when they’re all logged together. With so many layers in the Kubernetes container system, it becomes hard to handle.
Collecting all critical logs
If something goes wrong in your application, pods might be deleted and recreated quickly. What happens to the log file? Most likely, it will be lost as well. Failing to collect all the critical logs when something goes wrong will slow down your ability to solve the problem.
Kubernetes logging with BMC Helix Log Analytics
Managing Kubernetes logging manually can be difficult, but with BMC Helix, we take a different approach. Rather than trying to collect every log from across your pods and clusters, which is a tremendously difficult task to perform at scale, you can use BMC Helix Log Analytics Kubernetes log integration, which automatically collects logs for you, regardless of the format they are written in or where in your Kubernetes environment they’re stored. It lets you automate Kubernetes log collection and analysis, and avoid being overwhelmed by the complexity of Kubernetes logs. So, you can focus on gaining actionable visibility from those logs rather than struggling to figure out where each log is stored and how to collect it before it disappears.
BMC Helix Log Analytics automatically collects logs of all types from all components of your Kubernetes environment. It also eliminates the need for manual log aggregation. And by integrating with BMC Helix Operations Management with artificial intelligence for IT operations (AIOps), it allows you to analyze Kubernetes log data alongside metrics and other crucial sources of Kubernetes visibility to ensure that you gain full observability.
Collecting logs
The below diagram shows how logs are collected from a Kubernetes cluster using BMC Helix Log Analytics daemon set, which automatically collects logs from different files and locations across your node and cluster. You can also collect logs from all pods that host services running on the node within a cluster.
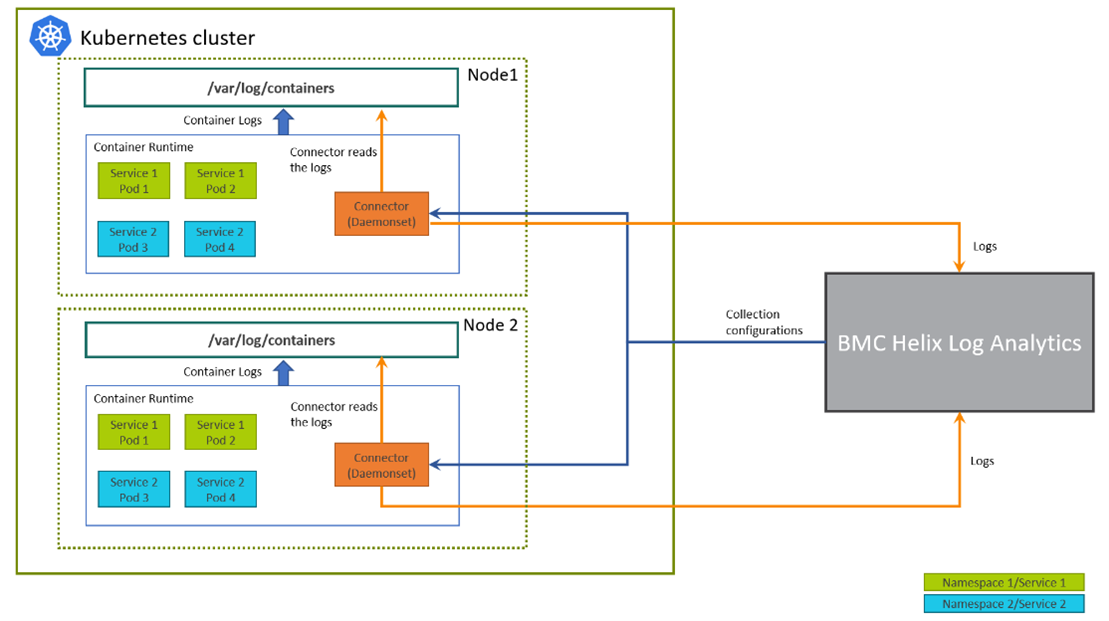
Figure 1. Logs are collected from a Kubernetes cluster.
BMC Helix Log Analytics provides Kubernetes connector to collect logs from your Kubernetes cluster deployment. You need to setup collection configurations, download docker connector image, upload the connector image to docker repository and install the connector on cluster nodes.
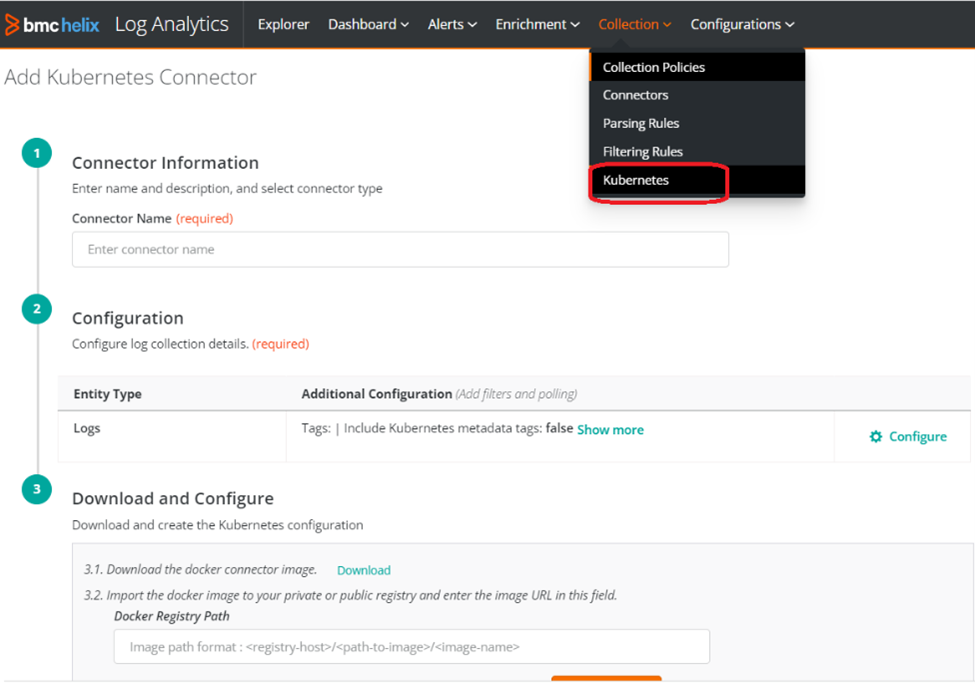
Figure 2: K8s connector for collecting logs
When you configure a Kubernetes connector, you can specify the namespaces, services, and Kubernetes metadata tags. You can also specify the application format, as well as provide log filters to include or exclude specific data.
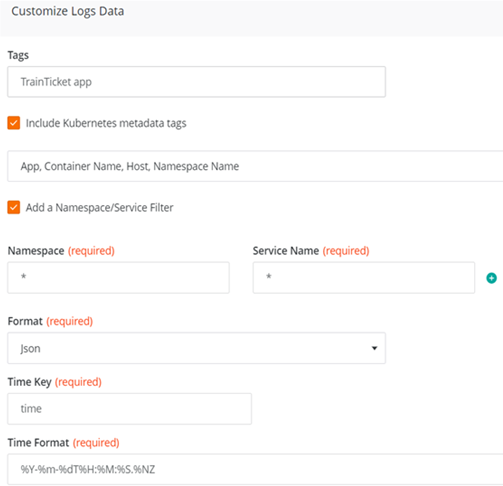
Figure 3. Configure Kubernetes meta tags, namespaces, and format
Monitoring, analyzing, and visualizing logs
Once the logs are collected, you can further analyze them in Log Explorer to search, discover, or query any log record to get more control over your logs.
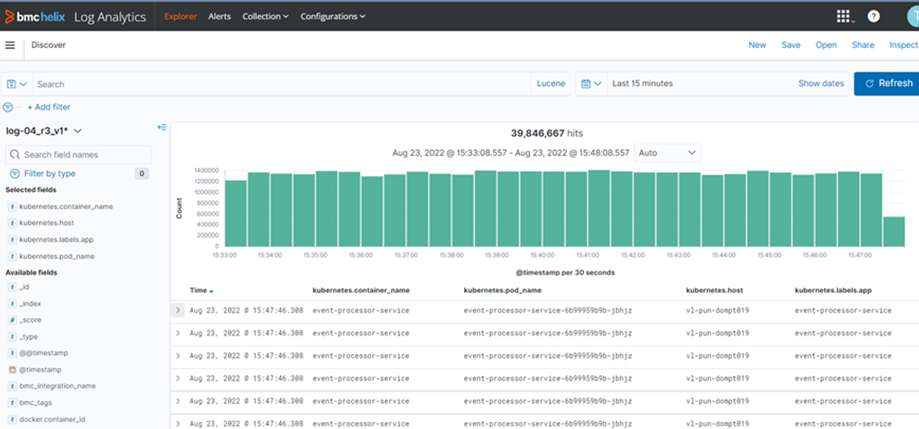
Figure 4. Discover and search logs in Log Analytics Explorer
Below is a self-service dashboard to monitor and visualize your Kubernetes deployment. Use this to keep track of the health of your Kubernetes environment and the applications running on it.
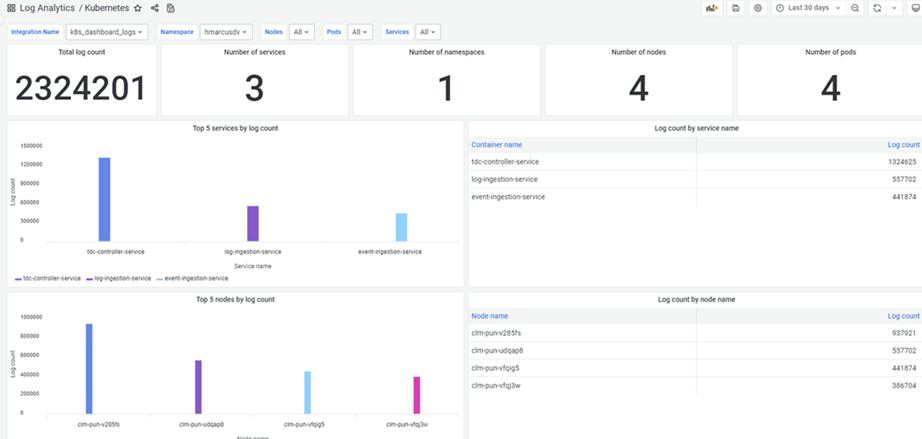
Figure 5. BMC Helix Log Analytics self-service dashboard.
In essence, don’t let the complexity of Kubernetes log management prevent you from gaining true observability of your Kubernetes clusters. Use BMC Helix Log Analytics to perform the tedious work of log collection and configuration so you can focus on analyzing logs and derive meaningful insights to improve and optimize your containerized application. When used with using BMC Helix Operations Management to monitor metrics and trace data for Kubernetes, it delivers fully contextualized data about the state of your Kubernetes cluster and the applications running in it.
BMC brings the power of the BMC Helix platform to site reliability engineers (SREs), DevOps engineers, and developers as an integral part of the BMC observability solution set. With a seamless and streamlined workflow for IT monitoring, troubleshooting, and investigation, you can easily go from problem detection to resolution in minutes.
To find out more about log collection from Kubernetes, please check out our BMC Helix Log Analytics product documentation here.
To learn more about BMC Helix Log Analytics capabilities, watch our overview video here or refer our product documentation here.