It is often said that a picture is worth a thousand words. The human brain processes images 60,000 times faster than text, and 90% of information transmitted to the brain is visual. Thus, humans respond to and process visual data better than any other type of data.
And when it comes to operational activities—like what you do at work, day in, day out—visualizing what exactly is going on has become a key capability.
Value stream mapping (VSM) is fast becoming one useful technique for visualizing delivery of products and services in order to identify opportunities for improvement. Let’s take a look.
What is VSM?
The ITIL® 4 Foundation publication defines a value stream as a series of steps an organization undertakes to create and deliver products and services to consumers.
Value stream maps are also one of the tools from Lean manufacturing. VSM visualizes the flow of a single product or service from supplier to customer, with the aim of identifying delays and processes that don’t add value.
The core principle of Lean manufacturing is the elimination of waste—any activity that does not add value from the customer’s perspective—in essence making the organization ‘lean’. The value stream map provides a basis for identifying unnecessary work (‘Muda’), particularly with regard to:
- Time
- Materials
- Processing activities
Lean thinking begins with one simple aspect: identifying value. This is the core objective of Lean management. But, without a clear picture of how you deliver value today, you can’t improve your value-creation process.
VSM provides that clarity for us by charting the flow of work through the different steps involved in the development/delivery of a product or service.
- Flow is ‘good’ when work moves steadily and predictably in relation to customer demand and supplier capacity.
- Flow is ‘bad’ when work starts and stops erratically and frequently.
By visualizing flow, VSM helps organizations move from bad to good through improvements in productivity and reduction in waste—leading to value creation for both you, as the supplier, and your customers.
(Learn about other mapping visualization approaches, like Wardley Value Chain Mapping, BPMN, and Business Capability Mapping, to improve company processes.)
Who uses VSM?
While VSM origins are in the manufacturing sector, the concepts apply to any product or service delivery framework, including:
- Logistics
- Software development
- Healthcare
- Government services
Basics of VSM notation
The below diagram is a basic example of a value stream map applied to a fast-food delivery restaurant:
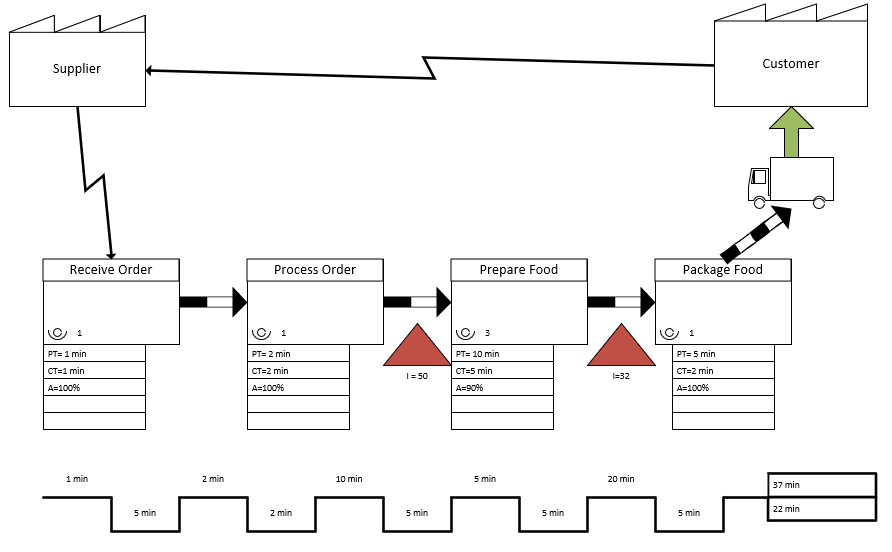
Take a look at the diagram. You’ll see that a value stream map is a unique flow chart that uses special symbols to visualize flow of product materials. VSM breaks down the different steps and provides information related to that step based on:
- Time
- Quantity
- Quality
- Other relevant metrics
A basic overview of symbols used in VSM as defined in Lean include:
- Symbols representing customer and supplier, in the upper corners, look something like a warehouse.
- Symbols representing activities identify the main process steps, with a spot to indicate how many participants are needed. In our example, preparing food involves 3 participants, while the other steps require only 1 person.
- The data boxes represent information about the flow at each process step. In our example, we have included the following:
- Process time (PT): The time one product spends in a process step.
- Cycle time (CT): The time between two products coming out of the process step.
- Availability (A): The percentage uptime for the activity equipment.
- Two symbols represent flow direction. The thick, black-and-white arrows represent a push or move from one process step to another. The thin-line arrows represent information flow, both manual and electronic.
- The red triangles represent stored inventory, which includes any products/materials that are stopped and waiting for processing. This is different from products being worked on. The stored inventory can reveal wastes such as delays and overproduction.
- At the bottom, an up-down line represents the timeline.
- The upper step denotes useful processing time.
- The lower step indicates useless processing time, such as waiting and delays.
- The total times are summed at the end, to the right.
Creating a value stream map
It is clear that drawing value stream maps is a specialist skill. For some organizations, the basics might be enough. For more complex value streams there would be need for higher levels of knowledge.
- At the start, a whiteboard and markers might be enough to put together a decent value stream.
- Beyond that, mapping software might be required to manage icons and data.
- At the very top, the most complex, you would need automated tools that automatically collect and process data from the equipment being used.
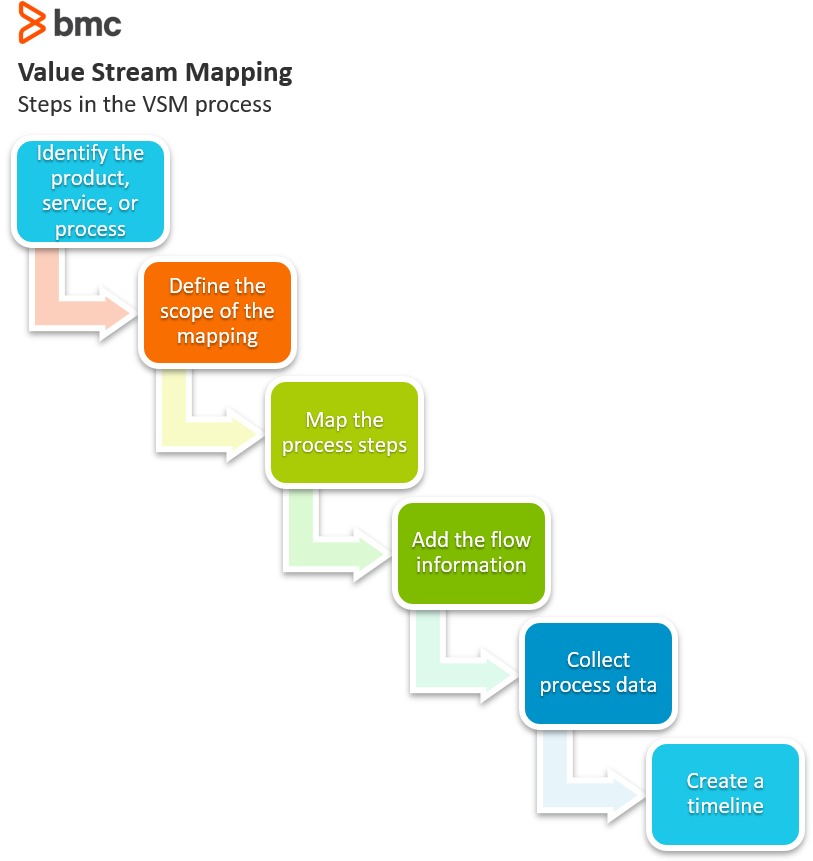
Steps in mapping value streams
VSM brings together different stakeholders in the entire product creation/delivery lifecycle to perform two key tasks:
- Plot the current state.
- Identify an agreed future state where the lifecycle is optimized through the implementation of improvement initiatives that target reduction/elimination of delays and non-value adding activities.
Ideally the stakeholders should hold the exercise exactly at the point where the activities take place in order to get a first-hand view of the activities. (This is called ‘gemba’—the real place). They also need to have access to data that supports the different activities, with regard to timelines and inventory.
The steps involved in creating a value stream map can be summarized as follows:
Limitations of value stream mapping
For structured and standardized activities, VSM is perfect in identifying bottlenecks and sources of inefficiencies.
However, some activities are complex and heuristic in nature, requiring creativity, problem solving, and use of different elements at different times. These types of tasks are notoriously tricky to map.
VSM might not be the best tool for process activities where time, materials, and participants are highly variable. You might also struggle to map value streams when:
- You lack the knowledge required for mapping
- You don’t have the right configuration of automated systems to collect the related data.
- Your company culture has minimal knowledge sharing across functional siloes
In summary, it can be incredibly difficult to gain the kind of actionable insights an enterprise requires in order to make operational improvements.
VSM can help achieve significant visibility in product delivery activities, which supports value creation through the identification of improvement opportunities that enhance efficiency and effectiveness.
Related reading
- BMC Business of IT Blog
- How to Apply Lean Startup Concepts to the Enterprise
- ITIL vs Lean Six Sigma: What’s the Difference?
- Data Visualization Guide, a series of examples and tutorials
- Business vs IT vs Digital Transformation: Strategy Across 3 Critical Domains
These postings are my own and do not necessarily represent BMC's position, strategies, or opinion.
See an error or have a suggestion? Please let us know by emailing blogs@bmc.com.