
Syslog is an event-logging standard that lets almost any device or application send data about status, events, diagnostics, and more. It’s commonly used by network and storage devices to ship observability data to log analytics platforms in order to support and secure the enterprise. These log messages contain information about the operation and status of devices, as well as any errors or issues that may have occurred. Syslog monitoring is typically used to keep track of system and network events, detect security threats, and troubleshoot problems.
Syslog, which stands for system logging protocol, has been in use since 1980 and has become the standard for logging on many Unix-like systems. It can use User Datagram Protocol (UDP) or Transmission Control Protocol (TCP) for event delivery over the network.
Benefits of syslog monitoring
Improved security
Syslog monitoring can be used to identify and prevent security threats by detecting unusual activity or suspicious log messages or finding patterns of potential security attacks. For example, if a device on the network is attempting to access unauthorized resources or is behaving in a way that is outside of the normal range of activity, syslog monitoring can alert the administrator to this activity.
Enhanced network visibility
By collecting and analyzing log messages from all devices on the network, syslog monitoring can provide a comprehensive view of network activity and help administrators identify and resolve issues such as a sudden increase in traffic or a spike in errors.
Improved troubleshooting
Syslog monitoring can help administrators quickly locate problems, as well as identify and fix the root cause of issues. For example, if multiple devices on the network are generating similar log messages, it may be a sign that there is a problem with a shared component or configuration.
Enhanced compliance
Regulations such as the Health Insurance Portability and Accountability Act (HIPAA), Payment Card Industry Data Security Standard (PCI-DSS), and Sarbanes-Oxley Act (SOX) have specific requirements for the collection, storage, and analysis of log messages as a way to ensure the security and integrity of systems and networks. By using syslog monitoring to collect and store log messages from all devices on the network, organizations can demonstrate compliance with these requirements by providing a record of all activity on the network.
Popular use cases with syslog
Firewall monitoring
Firewall log analysis reveals a lot of information about security threat attempts at the periphery of the network and the nature of traffic coming in and going out of the firewall.
Monitoring network devices
All of your network and Internet of Things (IoT) devices generate vast amounts of data to support a number of use cases. When a device is compromised, you’ll definitely want to know what the hacker is up to, how they accessed the devices, the firmware version, and whether or not they are even operational.
Open systems logging to support operations and security
If you work in the open systems world, syslog is the most common method for getting operations and security data off that system and into your security framework.
Monitoring storage devices
Storage devices are a massive data source, especially with the growing number of security requirements being put in place, which makes storage monitoring with syslog a major security use case.
Sending alerts
Syslog alerting is beneficial in many situations where you need to be notified about events like server start up, sudden server shutdowns, broken connections, configuration reloads and failures, runtime configuration impact, resource impact, and other events. All of these alert notifications can aid in determining whether or not the servers are operational, especially when you’re responsible for hundreds of servers.
Monitoring syslog with BMC Helix Log Analytics
As an observability engineer, you need to work with syslog data in a scalable way, as this ensures that you have quality data outputs and your operations and security teams get the right data to help them do their jobs. This is where the syslog monitoring capabilities provided by BMC Helix Log Analytics help to solve your problems by providing an easy-to-navigate user interface (UI) for collecting, aggregating, analyzing, and visualizing the syslog data and sending alerts.
Collecting syslog
The data flow diagram below illustrates how syslogs are collected and configured using BMC Helix Log Analytics. The log connector collects logs from the syslog daemon server and forwards to BMC Helix Log Analytics for further processing and storage.
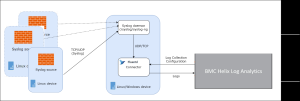
Figure 1. Data ingestion from syslog sources into BMC Helix Log Analytics.
BMC Helix Log Analytics provides a log collection policy to collect syslogs from one or more connectors.
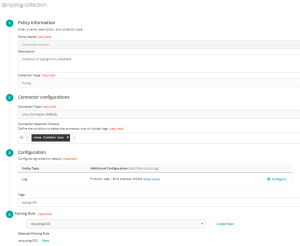
Figure 2. Log collection policy for syslog.
You can configure syslog collection by providing fields like a bind address with a default value of 0.0.0.0, port with default 5140, transport UDP or TCP, and parse syslogs as per RFC 3164 and RFC 5424.
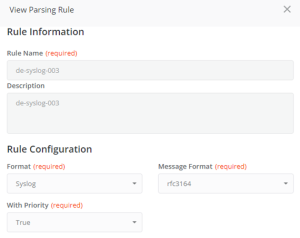
Figure 3. Syslog parsing.
Analyzing syslog
The log explorer helps you search and analyze syslogs and provide quick insights into the data. You can query the logs, apply filters, and see a time-based count of log distribution.
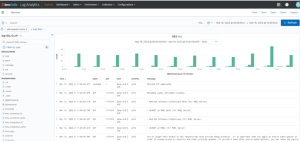
Figure 4. Analyzing syslog in Explorer.
Next, you can click on any log record to slice and dice further for more meaningful information for your operations or troubleshooting needs.

Figure 5. Detailed analysis of syslog record.
Syslog messages contain severity level fields that can be used to report levels of emergency and warnings in case of software or hardware issues. A system restart, for example, will be sent through the notice level. Through the informational level, system reloads will be delivered. If debug commands are sent, they are sent via the debug level. The IT administrator can create alert policies based on these severity fields, which allow IT operations team to take proactive actions.
To cut through the noise and focus on the key events that matter, you can search the logs by hostname, service, source, messages, and more. Further, when you can correlate log events in context of BMC Helix Service Monitoring powered by AIOps, it makes troubleshooting easy and gets to the root cause faster.
Visualizing syslog
BMC Helix Log Analytics provides an out of box syslog dashboard that helps to visualize syslogs. You can also drill down from the dashboard to specific data points to speed up the process of investigating unusual occurrences and quickly determine whether they’re a sign of a real problem.
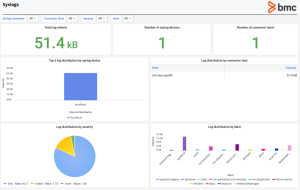
Figure 6. Out of box BMC Helix dashboard for syslog monitoring.
Syslog is a very common and widespread method for transmitting data from network devices and open systems servers. Many applications support sending data to syslog because it is a standard protocol. You can quickly audit security, monitor application behavior, and keep track of other vital server information by centralizing this data.
BMC Helix Log Analytics is purpose-built to help businesses simplify syslog management so engineers can spend more time delivering business value projects and less time moving data around the enterprise. The solution is delivered as a fully managed cloud service or on-premises with minimal setup at any scale and requires no maintenance. It monitors logs from all of your systems and applications in a centralized and easy-to-navigate user interface, allowing you to troubleshoot faster. For more information, visit the BMC Helix Log Analytics documentation page.