
Debugging Java Virtual Machine (JVM) crashes is a common troubleshooting task for Java developers. In this blog, I’ll explain the methodology and process you can use to troubleshoot an OutOfMemory (OOM) exception due to a thread leak to help you easily find the root cause of Java crashes.
Why do I get OOMs?
OOM errors are not new to a Java developer. They’re Java’s way of telling us that there is insufficient memory to allocate an object. There are many flavors of OOMs that one can experience while working with a Java program. The most common occurs when Java heap space runs out. There are other flavors like exceeding the garbage collection (GC) overhead limit or swap space, etc. You might also get an OOM error while creating a new thread. Here are some possible OOM scenarios.
- If there are multiple Java processes running on the server, process A could be consuming a large thread count while process B complains about this error in the log. (That B process is also often responsible for generating the large thread leaks.)
- Operating system (OS) open file handles have been exceeded, or the process permitted for the logged in user has been exceeded.
- A thread leak is causing a memory shortage at the server, which will cause the JVM process to throw out an OOM error.
- A possible thread leak in a third-party library or product.
Note: If it is a VM, make sure that the server you are working in has the right resources assigned, especially when it’s in a shared cluster and other VMs are consuming more memory than required.
Recipe for troubleshooting thread leaks
Every application flow and environment will be different, so troubleshooting actions will also vary accordingly. That said, our process for troubleshooting and confirming the culprit code for a thread leak is to:
- Set up the server for troubleshooting
- Identify the suspect process causing thread leaks
- Generate a thread dump and heap dump
- Narrow down the leaky code
Here is a sample code that can be deployed on the server to generate the OOM:
import java.util.concurrent.Executors;
import java.util.concurrent.ThreadPoolExecutor;
public class OutOfMemorySimulate {
public static void main(String[] args) {
OutOfMemorySimulate simulate = new OutOfMemorySimulate();
while(true)
simulate.execute();
}
private void execute() {
System.out.println("Processing the data.");
ThreadPoolExecutor executor = (ThreadPoolExecutor) Executors.newFixedThreadPool(4);
for (int i = 0; i < 10; i++) {
MyThread task = new MyThread();
System.out.println("A new task has been added : " + task.getName());
executor.execute(task);
}
System.out.println("Process");
}
}
Next, run this the command:
java OutOfMemorySimulate -Xmx100m -XX:+HeapDumpOnOutOfMemoryError -XX:HeapDumpPath=/tmp/simulate.hprof
Follow the steps below to reach the culprit code.
Step 1: Set up the server for troubleshooting
There are a few things you need to do to check up on the server, as follows:
- Since the server may not have a Java Development Kit (JDK) set up, copy the JDK .tar file to your server
- Extract the Java .tar file with the following code:
- $cd /tmp
- $tar -xvf jdk-11.0.10+9.tar
Step 2: Identify the suspect process
Now that you’re ready to explore and troubleshoot, let’s try to find out something about our process, starting with more descriptive output:
$ ps -aef | grep java
user 41 1 7 Jun05 ? 02:31:08 java -XX:+HeapDumpOnOutOfMemoryError -XX:HeapDumpPath= -Xmx100m
Next, let’s check how much memory the process is consuming:
$ top
PID USER      PR  NI    VIRT    RES    SHR   S  %CPU %MEM     TIME+ COMMAND
41user         20   0      4.9g    1.6g  26220 S    8.6       5.9         151:21.34 java
Note that although we have set the -Xmx JVM parameter to 100m, the resident memory usage kept increasing, as shown highlighted in yellow above.
This indicates that:
- The Java process heap memory is not occupied, so the program is not inadvertently allocating objects into heap space.
- The OS still has a memory shortage.
- The OS has denied the allocation of more memory to the Java process.
- This could be the thread leak.
If you check the logs, then you should also notice an exception similar to below:
Exception in thread “main” java.lang.OutOfMemoryError: unable to create native thread: possibly out of memory or process/resource limits reached
at java.base/java.lang.Thread.start0(Native Method)
at java.base/java.lang.Thread.start(Thread.java:803)
at java.base/java.util.concurrent.ThreadPoolExecutor.addWorker(ThreadPoolExecutor.java:937)
at java.base/java.util.concurrent.ThreadPoolExecutor.execute(ThreadPoolExecutor.java:1343)
at OutOfMemorySimulate.execute(OutOfMemorySimulate.java:21)
at OutOfMemorySimulate.main(OutOfMemorySimulate.java:11)
So, the OOM does seem to be related to the thread leak. It’s time to check the thread dump.
Step 3: Generate thread dump
Let’s look at the various ways to create a thread dump of the process on the server.
JDK provides a jstack utility, which can attach to a specific Java process and print stack traces of all threads, including native stack frames. To do this, you will need the Java process ID (PID) from the ps -ef command (for UNIX) explained earlier.
$ jstack -l <PID>
This prints the full thread dump. At the top of the thread dump (or by searching within the dump file), you will be able to find the thread counts.
Threads class SMR info:
_java_thread_list=0x0000012b82c90830, length=46723, elements={
0x0000012bc020d000, 0x0000012bda8d7000, 0x0000012bda8e0800, 0x0000012bda931000,
0x0000012bda932000, 0x0000012bdb231800, 0x0000012bdb23c000, 0x0000012bdb25d800,
0x0000012bdb3bd000, 0x0000012bdb3c8000, 0x0000012bdb3da000, 0x0000012bdb3db000,
0x0000012bdb3db800, 0x0000012bdb3dc800, 0x0000012bdb3e5800, 0x0000012bdb3e8000,
0x0000012bdb3e9000, 0x0000012bdb3e9800, 0x0000012bdb3ea800, 0x0000012bdb3eb800,
As you can see in the highlighted text in the figure above, there are many (45,000+) threads within the thread pool, and that number will increase continuously.
The stack trace for the threads in the WAITING state would have the following pattern:
"pool-11679-thread-1" #46725 prio=5 os_prio=0 cpu=0.00ms elapsed=1.76s tid=0x0000012b82b72000 nid=0xaabc waiting on condition  [0x0000002e006fe000]
java.lang.Thread.State: WAITING (parking)
at jdk.internal.misc.Unsafe.park([email protected]/Native Method)
- parking to wait for  <0x00000000fe543518> (a java.util.concurrent.locks.AbstractQueuedSynchronizer$ConditionObject)
at java.util.concurrent.locks.LockSupport.park([email protected]/LockSupport.java:194)
at java.util.concurrent.locks.AbstractQueuedSynchronizer$ConditionObject.await([email protected]/AbstractQueuedSynchronizer.java:2081)
at java.util.concurrent.LinkedBlockingQueue.take([email protected]/LinkedBlockingQueue.java:433)
at java.util.concurrent.ThreadPoolExecutor.getTask([email protected]/ThreadPoolExecutor.java:1054)
at java.util.concurrent.ThreadPoolExecutor.runWorker([email protected]/ThreadPoolExecutor.java:1114)
at java.util.concurrent.ThreadPoolExecutor$Worker.run([email protected]/ThreadPoolExecutor.java:628)
at java.lang.Thread.run([email protected]/Thread.java:834)
There are other ways to obtain the thread dump. You can use any proprietary tool, such as the YourKit Java Profiler or the kill -3 <PID> command in UNIX, etc.
Step 4: Narrow down the leaky code
To confirm our analysis further, we will also generate a heap dump, which will help us reach the exact location of the code that is causing the thread leaks. You can do this a few ways:
- Use the heap dump that is generated after the Java process has crashed. Remember that you need to specify the -XX:+HeapDumpOnOutOfMemoryError as part of the Java command starting the Java process.
- Specify the path of the storage where there is sufficient disk space available:
-XX:HeapDumpPath. - In your server, make sure you have automation in place to copy the HPROF to a persistent location or provide the path to the persistent storage.
- Generate the heap dump manually by tracking the process memory where usage is high.
Let’s use JMap to take a heap dump of the Java process:
$ jmap -dump:live,format=b,file=/tmp/high-threads.hprof <PID>
You can use different visual tools like JVisualizer, JMat, etc. to analyze the heap dump. The following is an example of how a heap dump analyzer can help you find the problematic code.
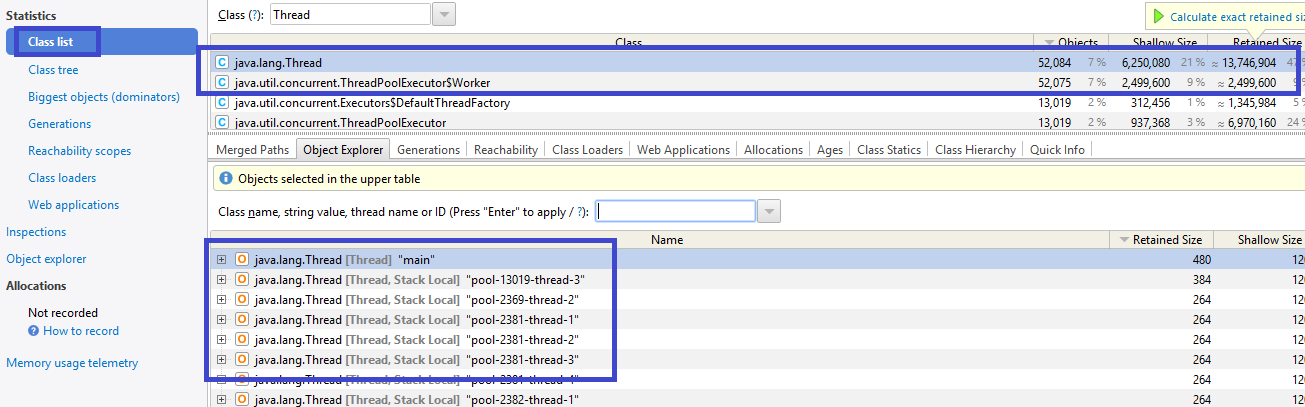
In this case, you can see that the thread object is taking up the top position with 52,000+ objects. The call traces will also confirm the line numbers to look for. The heap dump and thread dump analysis lead us to a condition where root cause are:
- Thread pool executors are used to create threads but executor.shutdown() is not called to release the thread objects.
- The thread pool executor should have been invoked at the initialization stage and not during the business process method, which is called during each transaction process.
- The Max Thread pool size is not defined, leading to spawning of new threads every time.
Conclusion
That’s just one example of our learnings while tracking down these tricky thread leakages that lead to continuous Java process crashes. We’d also recommend that you
- Conduct regular scans and set alerts on your application level when it generates and OutOfMemory exception.
- Use BMC Log TrueSight Monitoring and BMC TrueSight Generic JVM Monitoring to monitor your application logs.
- Do thread dump and heap dump analysis of your application to identify the thread leaks as part of the development process.
- For ad hoc/quick monitoring of your environments, use OS commands to count the threads being used for the process
ls  /proc/pid/task|wc -l
lsof -a -p pid |wc -l
- Set a limit on the maximum number of threads in the pool as a best coding practice while using scheduled thread pool execution.
- Keep self-monitoring turned on to monitor the maximum thread count of your process and troubleshoot and take recovery actions if it is crossing the threshold.
- At the OS level, make sure you have the “core file size to unlimited” set to the appropriate value ( ulimit –c) to let it generate the memory dump HPROF when an accident happens.
- Refer to the memory tuning explained on the link https://docs.bmc.com/docs/tsps113/troubleshooting-java-memory-management-935083760.html
These postings are my own and do not necessarily represent BMC's position, strategies, or opinion.
See an error or have a suggestion? Please let us know by emailing [email protected].