icon_CloudMgmt icon_DollarSign icon_Globe icon_ITAuto icon_ITOps icon_ITSMgmt icon_Mainframe icon_MyIT icon_Ribbon icon_Star icon_User icon_Users icon_VideoPlay icon_Workload icon_caution icon_close s-chevronLeft s-chevronRight s-chevronThinRight s-chevronThinRight s-chevronThinLeft s-chevronThinLeft s-trophy s-chevronDown

Persona-Based Service Health Dashboards

Get real-time, customizable dashboards that deliver system status insights tailored to specific roles.

How It Works

Activation

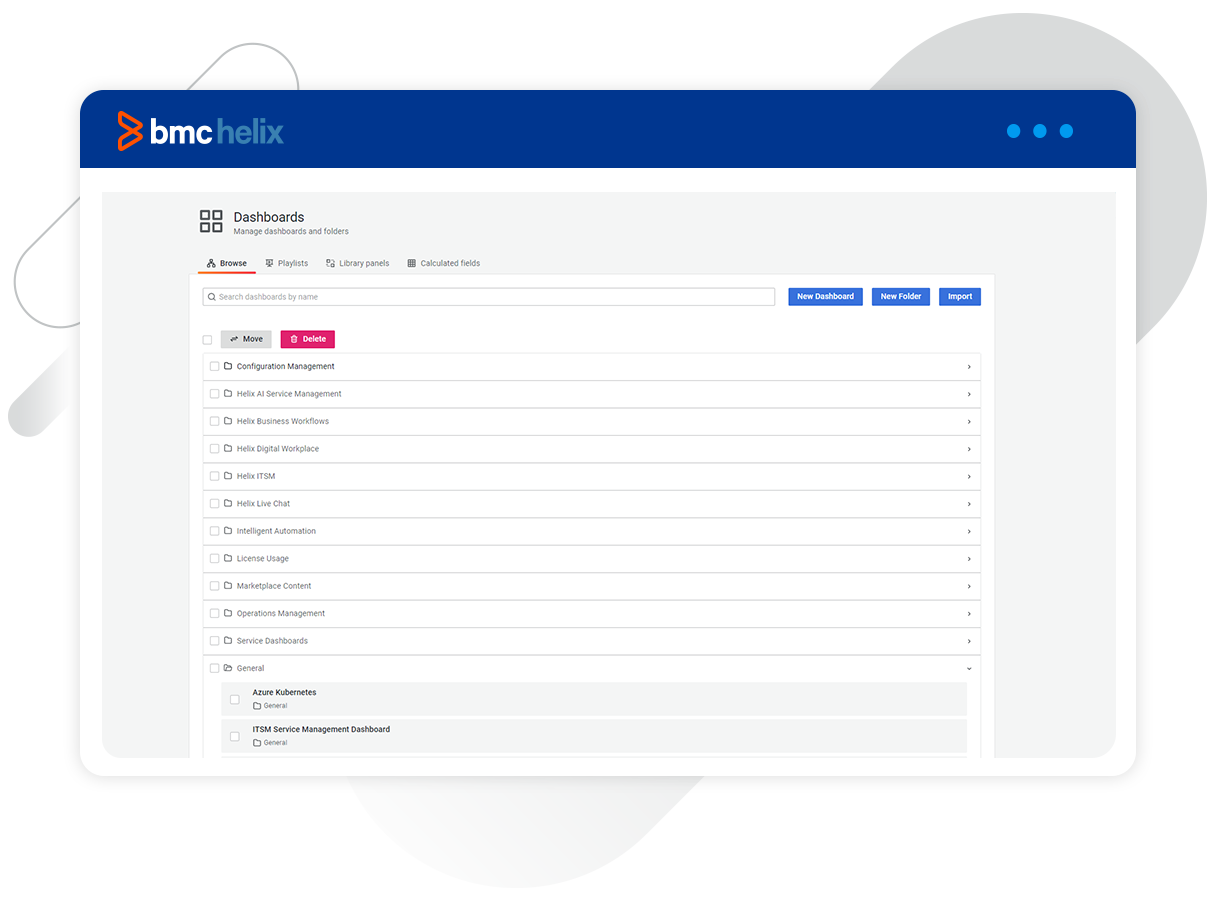
Activate your dynamic service model

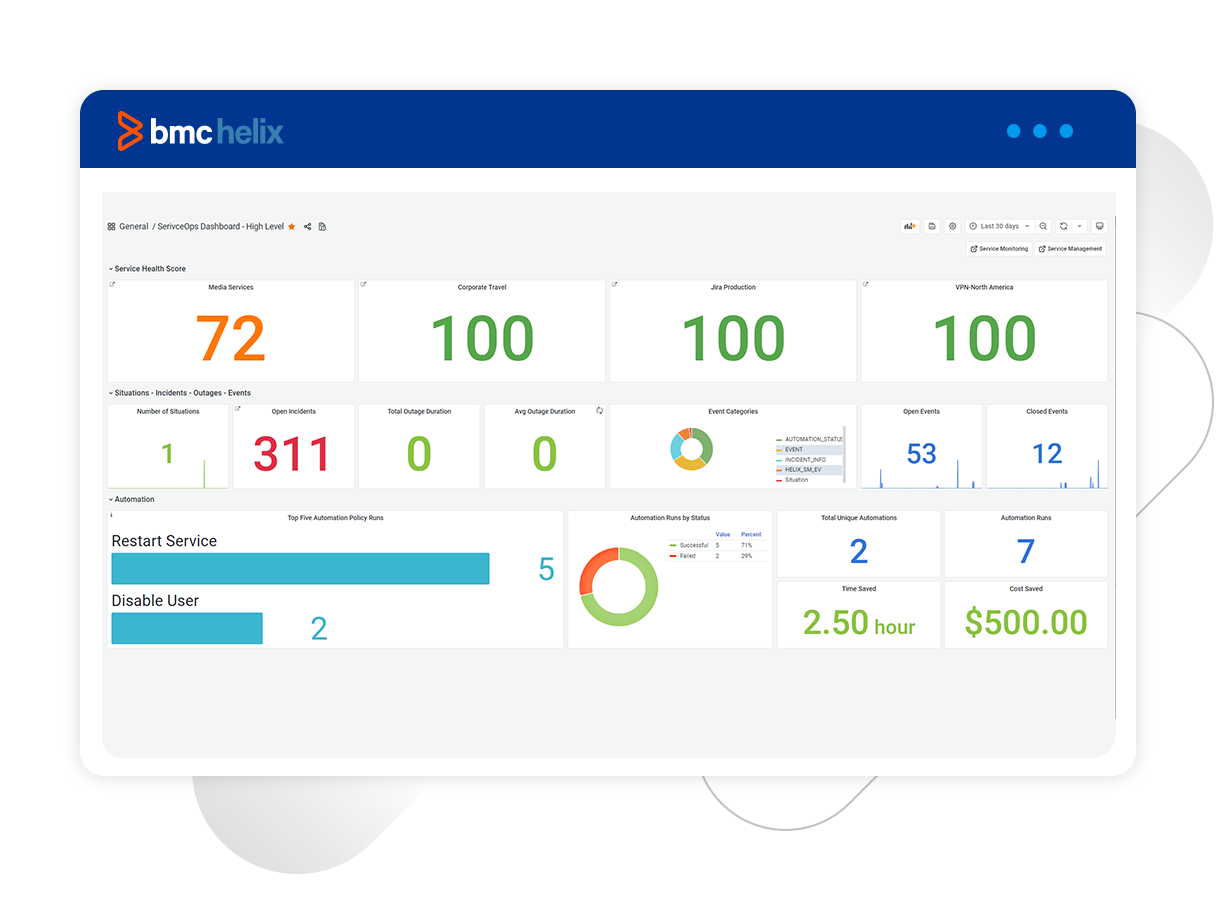
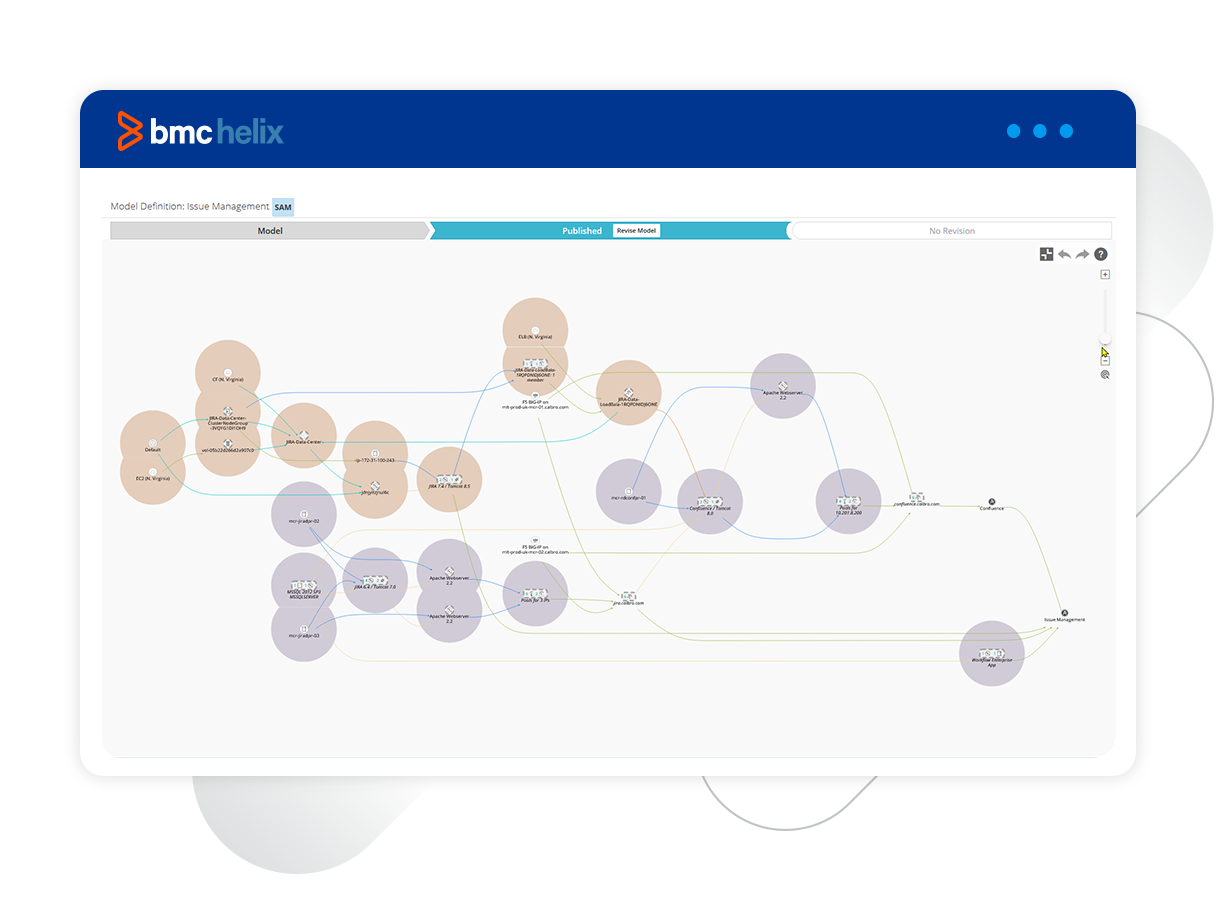
The beauty of dynamic service modeling—the practice of creating a service infrastructure model that stays up to date in real-time—is that it enables companies to be successful at both the macro and micro levels. At the macro level, the model provides a comprehensive mapping of every relationship and workflow in your IT ecosystem. At the micro level, you can leverage the model to create service health dashboards customized to users' roles, enabling them to quickly understand what's happening in their relevant areas and take action faster.

Customization

Set up your dashboards

You can get started immediately with out-of-the-box dashboard templates that are pre-trained for AI use cases and ready to use. You can further customize the dashboards using a library of configurable filters, tags, and annotations, as well as custom queries.

Vizualization

Gain clarity

Once your dashboards are up and running, teams will no longer need to switch between multiple applications or manually pull data to assess system health. Instead, they can rely on a single source of truth for quick insights into the business services that matter most to them. The user-centric experience translates to faster response times and happier customers.

4 Reasons You’ll Love It

Dashboards built from static reports quickly fall out of sync with reality, but dynamically updated dashboards are always on and reflective of what’s happening in your service environments at any given moment.

Get an intuitive understanding of your business service health at a glance with dynamically updated red, yellow, and green health indicators.

Choose from multiple ready-to-use dashboards that you can start using from day one (of course, you can also customize your own).

Anyone who needs a consolidated view of business data can get it in their own interactive, customizable dashboard.

No More Static Reports
Easy Vizualization
Dashboard
Consolidated View

Seamless Integrations

A few of our integrations include:

Prometheus
Google Cloud Monitoring
AWS Cloud Watch
Azure Monitor
Grafana Cloud

Frequently Asked Questions

Yes.

Yes.

Yes.

Yes.