
In this article, we’ll explain how to do outlier detection. Outlier detection is important in a variety of scenarios: credit card fraud, cyber security, and to detect, for example, faulty equipment in systems.
(This article is part of our scikit-learn Guide. Use the right-hand menu to navigate.)
The approach
The simplest approach for outlier detection is to assume a normal distribution and then set a threshold at some number of standard deviations. That’s called the z-score.
In this example, we’re using a different approach—an isolation forest. It’s a type of decision tree that picks values at random, splits each data point between a randomly selected range, then picks another randomly picked value on an ever-decreasing range of values until it runs out of values to split. Lastly, it flags as outliers those that are on the shortest path in that tree. This flags outliers by calculation an anomaly score.
In the sample below we mock sample data to illustrate how to do anomaly detection using an isolation forest within the scikit-learn machine learning framework.
The code, explained
The code for this example is here.
First, we pull 100 samples from a standard normal distribution with mean 4 and standard deviation 1 to create a 100×2 matrix:
train = rng.normal(4,1,(100,2))
Now, train that model:
from sklearn.ensemble import IsolationForest
clf = IsolationForest(behaviour='new', max_samples=100,
random_state=rng, contamination='auto')
clf.fit(train)
Next, we create another sample.
typical = rng.normal(4,1,(100,2))
If we print that we see that the values range between 2 and 6. So, we create outliers of values 8 and 1:
outliers = np.array([
[8,6],
[1,4]
])
Here is the complete code:
import numpy as np
import matplotlib.pyplot as plt
from sklearn.ensemble import IsolationForest
rng = np.random.RandomState(20)
train = rng.normal(4,1,(100,2))
typical =  rng.normal(4,1,(100,2))
outliers = np.array([
[8,6],
[1,4]
])
clf = IsolationForest(behaviour='new', max_samples=100,
random_state=rng, contamination='auto')
clf.fit(train)
pred_train = clf.predict(train)
pred_test = clf.predict(typical)
pred_outliers = clf.predict(outliers)
Here is a sample of the data. It ranges between above 1 and below 6, so we will mock data above and below 1 and 6, which the algorithm should flag as outliers.
typical
array([[2.49602218, 5.31396783],
[3.96987389, 4.63501308],
[4.50243523, 5.16196591],
[3.69425171, 5.71228277],
[5.169437  , 3.72418513],
[1.48821929, 3.58272819],
[4.54157245, 3.8548927 ],
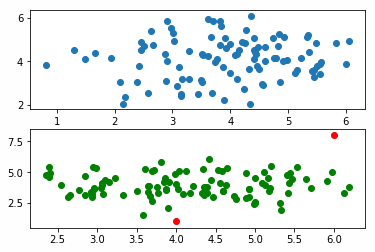
Then we run three predictions and plot them, plotting the second column in each matrix [:1] on the x columns and the first column on the y axis [:0], just as an easy way to visualize the pairs. Since they are drawn from a normal distribution, they cluster around the middle.
pred_train = clf.predict(train)
pred_test = clf.predict(typical)
pred_outliers = clf.predict(outliers)
fig, axis = plt.subplots(2)
axis[0].scatter(train[:,1], train[:,0] )
axis[1].scatter(typical[:,1], typical[:,0]  , c='g'  )
axis[1].scatter(outliers[:,1], outliers[:,0] , c='r'  )
The points [8,6] and [1,4] are outliers which is easy to see, since we plot them in red.
These postings are my own and do not necessarily represent BMC's position, strategies, or opinion.
See an error or have a suggestion? Please let us know by emailing blogs@bmc.com.