Let us know how we can help
Sales & Pricing
Speak to a rep about your business needs
Help & Support
See our product support options
General inquiries and locations
Contact usManage complexity and change across your business
Empower your organization with a fleet of AI agents that reduce toil and free up resources for high-value work.
Service Management
Elevate self-service through always-on agentic AI support to lower costs and drive vastly improved customer experiences.
BMC Helix ITSM: AI-driven IT service management for the modern enterprise
BMC Helix Employee Navigator: AI-powered virtual assistant that provides a conversational search experience, helping users quickly find information.
BMC Helix Customer Service Management: Exceptional customer experiences for improved brand loyalty
Try the free guided demoEmployee Engagement and Enterprise Service Management (ESM)
Deliver an instant and frictionless employee experience.
BMC Helix Enterprise Service Management: Personalized experiences, faster outcomes, and more time for your employees
BMC Helix Digital Workplace: Intuitive and engaging self-service and multichannel experiences
BMC Helix Business Workflows: Modern, customized case management built for service owners
AIOps and Observability
Discover, monitor, remediate, and optimize with AI agents designed for unprecedented business service reliability and holistic visibility.
BMC Helix Discovery: Comprehensive visibility and control over IT assets and services
BMC Helix Operations Management with AIOps: Automated root cause analysis and remediation, service-centric monitoring, and advanced event management
Netreo: Enterprise-grade network observability and management
BMC Helix Continuous Optimization: Predictive resource optimization and right-sizing intelligence for service assurance
SecOps and Compliance
Reduce risk and streamline responses to regulatory requirements.
Vulnerability resolution, minimized disruptions, and reduced threat exposure
Always-on monitoring of software, IT assets, and business services
Improved visibility and automated reporting for IT, SecOps, and service management teams
Dive deeper
Explore related resources
E-book
The State of Generative and Agentic AI for IT
The world of enterprise software is on the cusp of a transformative shift, driven by the rapid advancements of generative artificial intelligence (GenAI) and agentic AI, or autonomous agents.
Analyst Research
AIOps: A Crucial Component Of High-Performance IT
Use AIOps To Drive Observability And Business Outcomes In IT Operations.
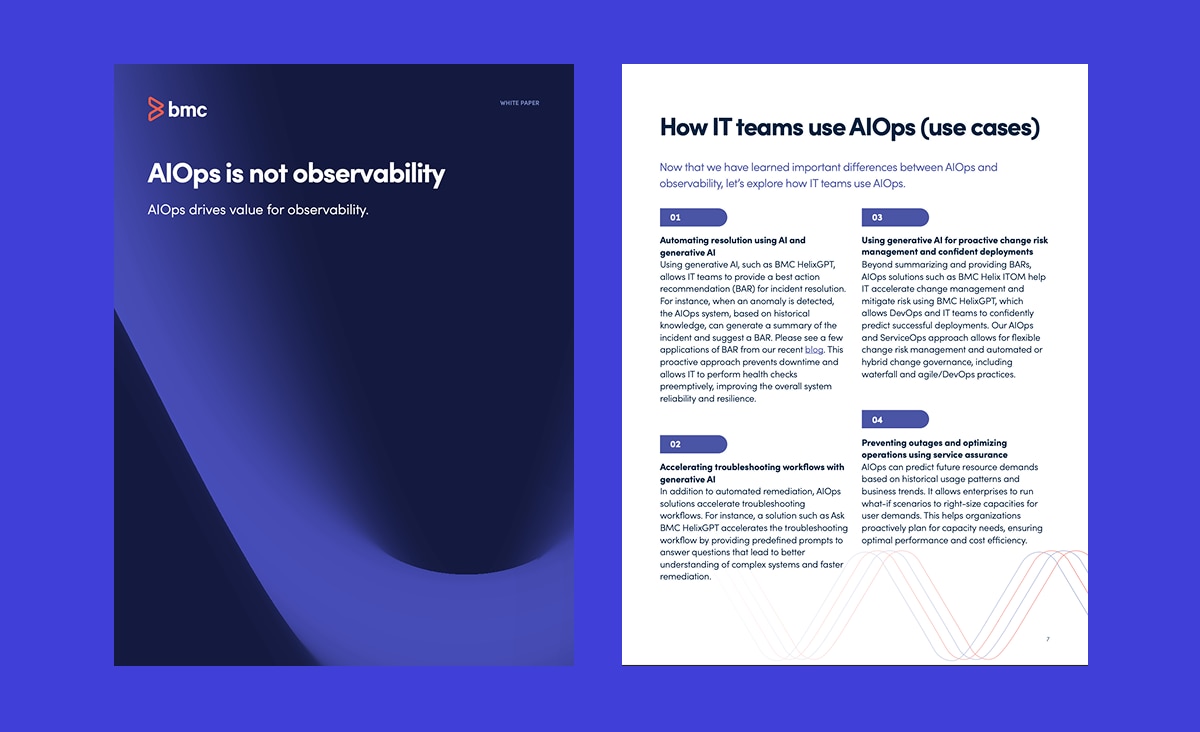
White Paper
AIOps is not observability
Learn how AIOps goes beyond observability with intelligent automation and proactive insights that drive IT efficiency and business value.

Video
Multiply Productivity with BMC Helix AIOps and Agentic AI
See how BMC Helix AIOps uses agentic AI to accelerate root cause analysis, deliver best-action recommendations, and drive faster remediation across IT operations.
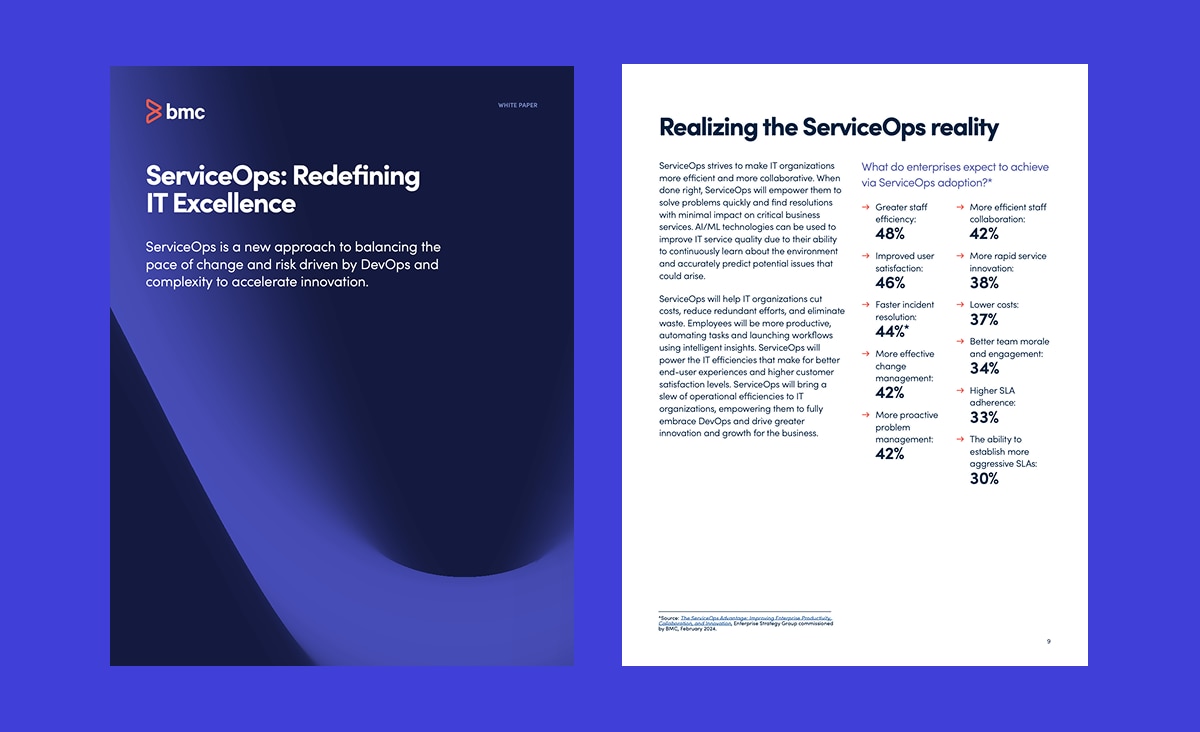
White Paper
ServiceOps: Redefining IT Excellence
Discover how AI-powered ServiceOps streamlines ITSM, ITOps, and DevOps to accelerate change, reduce risk, and enhance service quality—plus key best practices to evolve IT service management.

Analyst Research
The Forrester Wave™: AIOps Platforms, Q2 2025
BMC Helix receives highest scores possible in Vision, Roadmap, and Agentic AI, advisor, and assistant criterion in Forrester AIOps Platforms Wave
Customer Success
What our customers are saying
Jon Ozanne
CIO | Balfour Beatty
Get in touch