Let us know how we can help
Sales & Pricing
Speak to a rep about your business needs
Help & Support
See our product support options
General inquiries and locations
Contact us
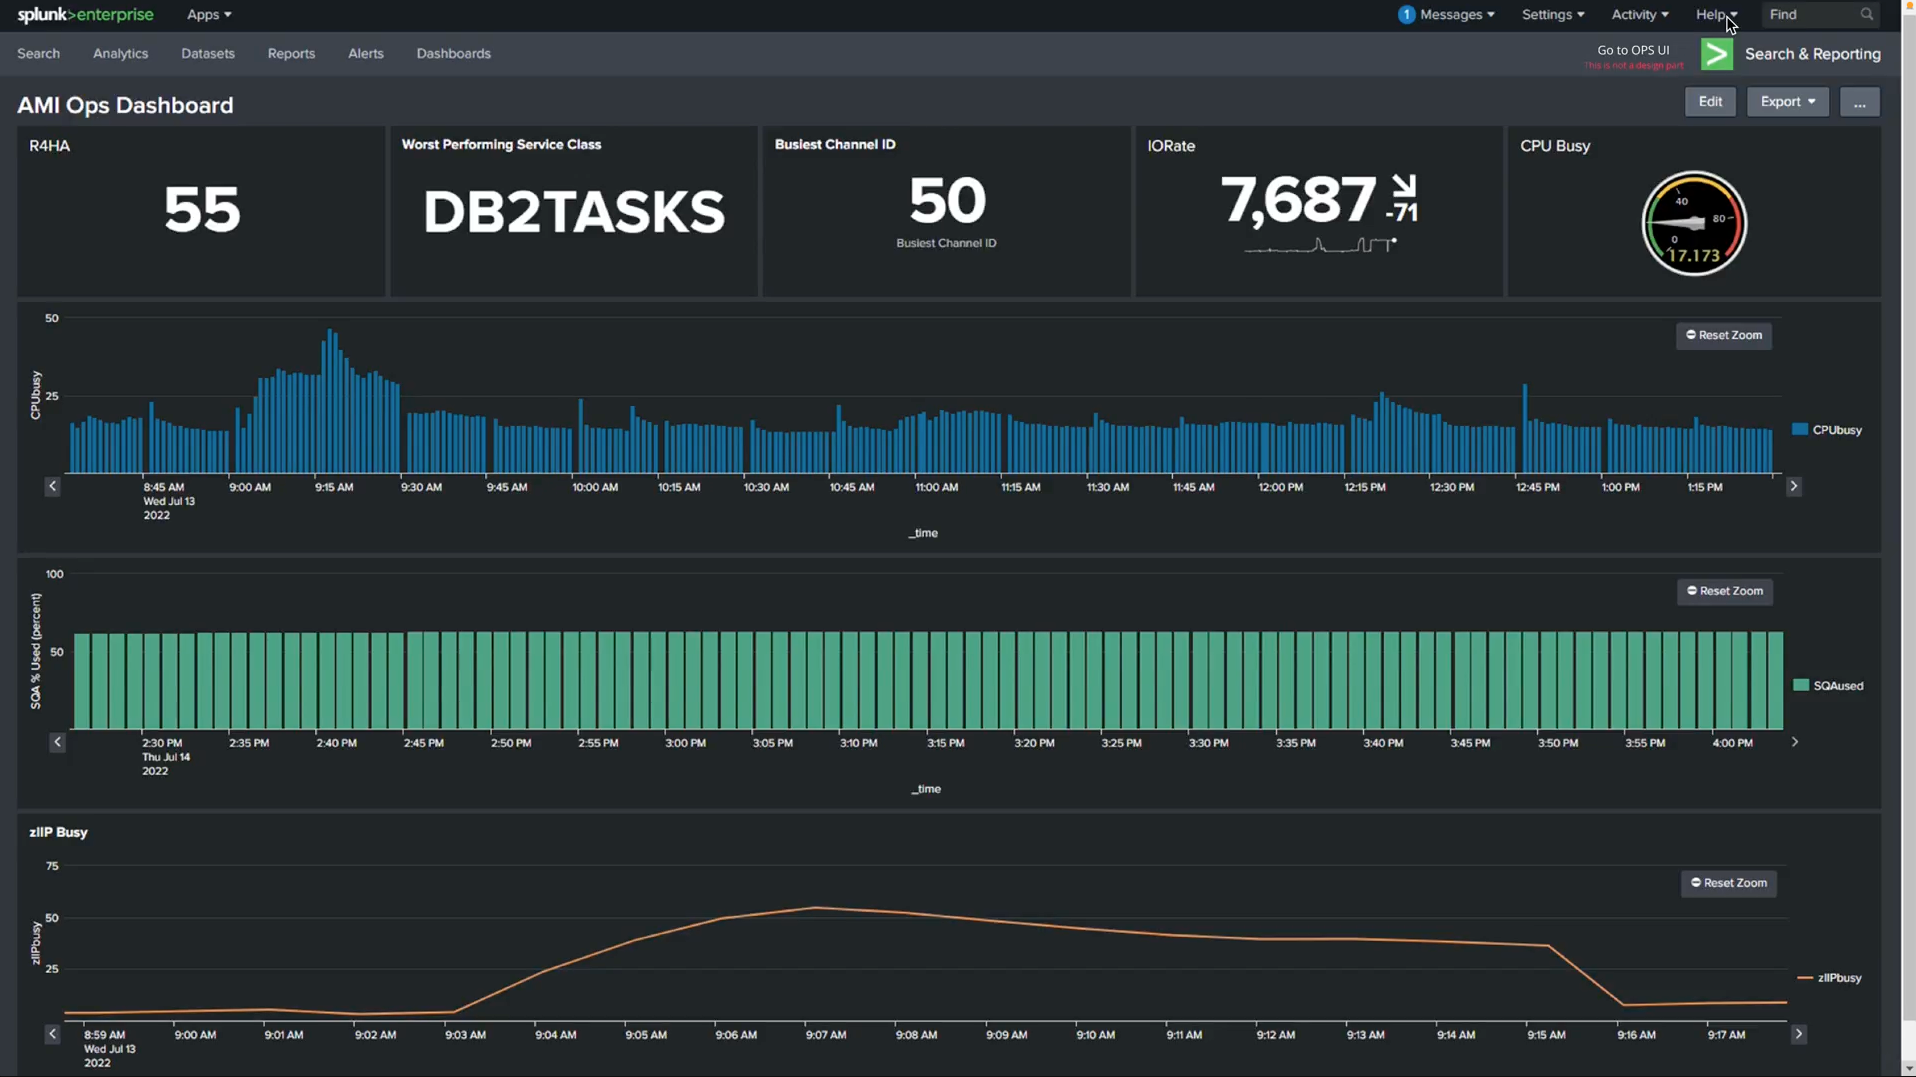
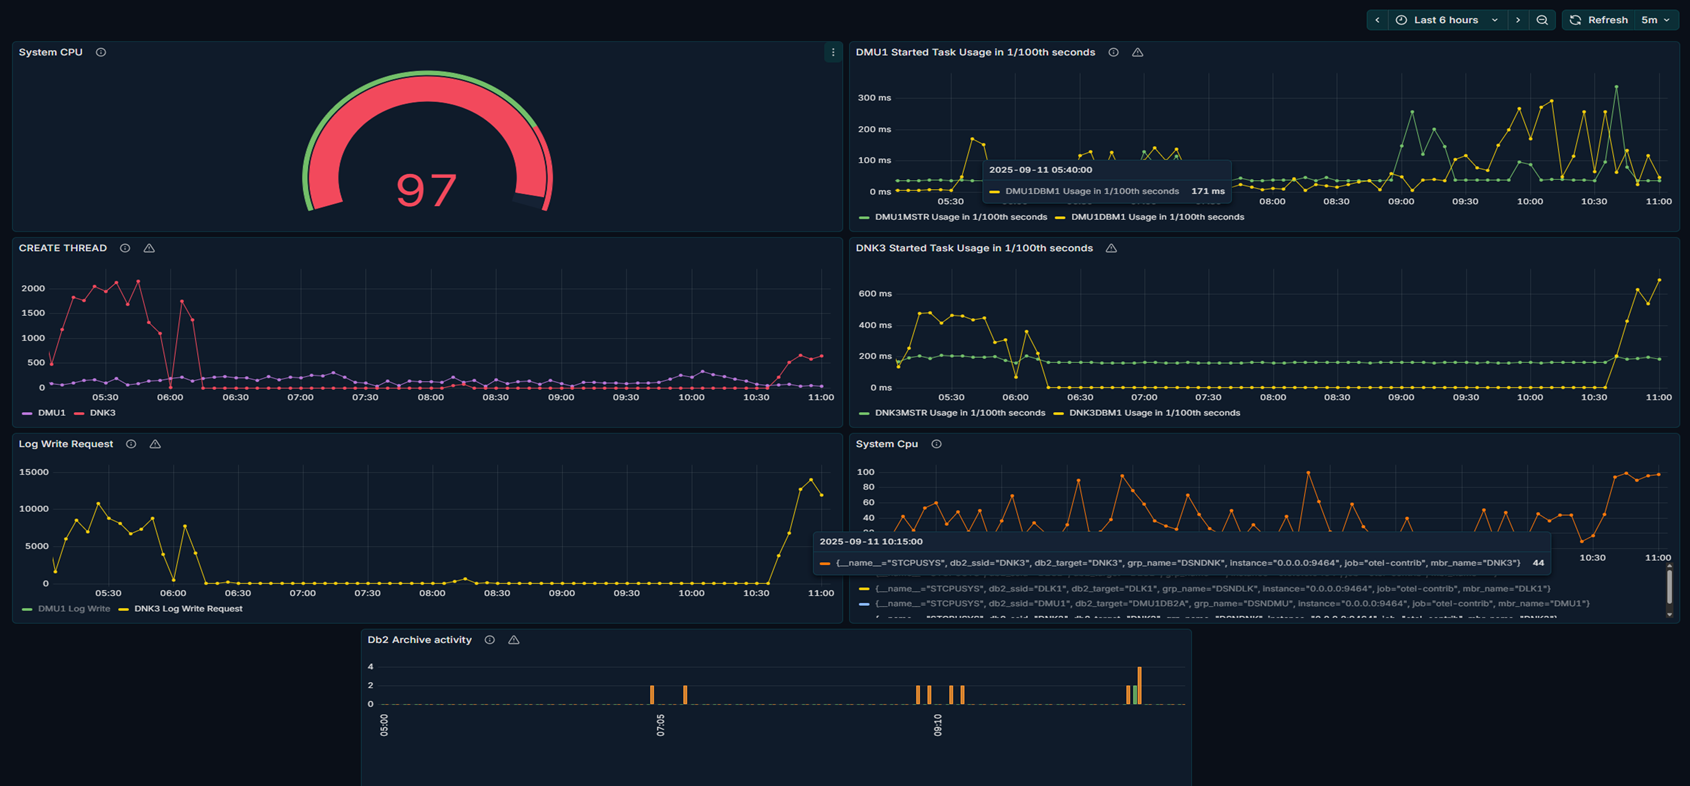
BMC AMI Datastream for Ops
Bring mainframe data into OpenTelemetry pipelines

Stream z/OS data in real-time into OpenTelemetry pipelines and enterprise observability tools—so teams can detect issues faster, understand mainframe impact, and break down data silos without custom integrations.

Bring mainframe data into your observability pipelines
Deliver real-time mainframe operational data into your existing observability tools—no custom work required and no more siloed data.
-
Send z/OS metrics and events into OpenTelemetry pipelines
-
Integrate with enterprise observability tools like Splunk, Dynatrace, Elastic, Grafana, Datadog, and others
-
Use data that’s already formatted and ready to go
-
Includes system and subsystem data from environments like z/OS, CICS, IMS, Db2, MQ, and more
-
Easily connect mainframe data into your observability tools—no custom pipelines required
Connect mainframe data to the rest of your stack
Bring real-time mainframe operational data into your observability tools so you can connect it with application and infrastructure signals across your environment.
-
Stream data from systems like z/OS, CICS, IMS, Db2, and MQ into your observability platform
-
Correlate mainframe activity with application and infrastructure data
-
Understand issues across end-to-end transactions and identify where problems start
Stream data in real time—without the overhead
Replace batch data collection with real-time streaming so teams can detect and respond to issues in seconds while maintaining performance.
-
Replace batch intervals with real-time streaming for faster detection and response
-
Filter and route only relevant data to control ingestion and storage costs
-
Minimize impact on mainframe resources while maintaining performance