
In this article, we’ll show how to divide data into distinct groups, called ‘clusters’, using Apache Spark and the Spark ML K-Means algorithm. This approach works with any kind of data that you want to divide according to some common characteristics.
This data shows medical patients, some with heart disease and some without it. We have already looked at this data using logistic regression. The classification will not tell us which have heart disease (that’s what logistic regression did in the previous post), but you can logically deduce that one set of patients is sick and the other is not, since the indicators of health are the input data.
(This tutorial is part of our Apache Spark Guide. Use the right-hand menu to navigate.)
Understanding the Spark ML K-Means algorithm
Classification works by finding coordinates in n-dimensional space that most nearly separates this data. Think of this as a plane in 3D space: on one side are data points belonging to one cluster, and the others are on the other side.
In this example, we have 12 data features (data points). You will see that the plane has the coordinates shown below. It’s not a plane per se, because there are more than three dimensions, but you could call it a hyperplane. (Still, the mental image of a plane is close enough to explain the example.)
Below, we divide the data into two clusters, which explains why we have two sets of coordinates. Those are the centroids, or the central point of each cluster.
If we try to divide it into a higher number of clusters, that becomes less accurate, as the data is not spaced sufficiently apart.
[5.68235294e+01 5.68627451e-01 3.25490196e+00 1.35803922e+02
3.00078431e+02 1.47058824e-01 1.18627451e+00 1.45225490e+02
4.01960784e-01 1.09705882e+00 1.59803922e+00 8.23529412e-01]
[5.29821429e+01 7.44047619e-01 3.12500000e+00 1.28636905e+02
2.19047619e+02 1.48809524e-01 9.22619048e-01 1.52380952e+02
2.85714286e-01 1.02142857e+00 1.57738095e+00 5.77380952e-01]
Here is the code stored as a Zeppelin notebook. (The related post, in this Guide, explains the data field and how to load the Spark dataframe.) The data is the same, except we add a patient ID column.
%spark.pyspark
def isSick(x):
if x in (3,7):
return 0
else:
return 1
import pandas as pd
from pyspark.sql.types import StructType, StructField, NumericType
cols = ('age',
'sex',
'chest pain',
'resting blood pressure',
'serum cholestoral',
'fasting blood sugar',
'resting electrocardiographic results',
'maximum heart rate achieved',
'exercise induced angina',
'ST depression induced by exercise relative to rest',
'the slope of the peak exercise ST segment',
'number of major vessels ',
'thal',
'last')
data = pd.read_csv('/home/ubuntu/Downloads/heart.csv', delimiter=' ', names=cols)
data['isSick'] = data['thal'].apply(isSick)
rowCount = data['age'].count()
ids = np.arange(1,rowCount+1,1)
data['id'] = ids
df = spark.createDataFrame(data)
from pyspark.ml.feature import VectorAssembler
features =   ('age',
'sex',
'chest pain',
'resting blood pressure',
'serum cholestoral',
'fasting blood sugar',
'resting electrocardiographic results',
'maximum heart rate achieved',
'exercise induced angina',
'ST depression induced by exercise relative to rest',
'the slope of the peak exercise ST segment',
'number of major vessels ')
assembler = VectorAssembler(inputCols=features,outputCol="features")
dataset=assembler.transform(df)
dataset.select("features").show(truncate=False)
This code below is taken directly from the Spark ML documentation with some modifications, because there’s only one way to use the algorithm. A couple items to note:
- KMeans().setK(2).setSeed(1)—The number 2 is the number of clusters to divide the data into. We see that any number larger than 2 causes this value ClusteringEvaluator() to fall below 0.5, meaning it’s not a clear division. Another way to check the optimal number of clusters would be to plot an elbow curve.
- predictions = model.transform(dataset)—This will add the prediction column to the dataframe, so we can show which patients qualify for which category.
The rest of the code is self-evident. The code prints the cluster centers for each division as well as the sum of squared errors. That’s a clue to how it works: it computes the distance of each data point from its guess as to the center of the cluster, adjusts the guesses, then repeats until the number reaches its minimum. The distance of each point from this central point is squared so that distance is always positive. The goal is to have the smallest number possible—the shortest distance between all the data points.
%spark.pyspark
from pyspark.ml.evaluation import ClusteringEvaluator
from pyspark.ml.clustering import KMeans
# Trains a k-means model.
kmeans = KMeans().setK(2).setSeed(1)
model = kmeans.fit(dataset)
# Make predictions
predictions = model.transform(dataset)
# Evaluate clustering by computing Silhouette score
evaluator = ClusteringEvaluator()
silhouette = evaluator.evaluate(predictions)
print("Silhouette with squared euclidean distance = " + str(silhouette))
# Evaluate clustering.
cost = model.computeCost(dataset)
print("Within Set Sum of Squared Errors = " + str(cost))
# Shows the result.
print("Cluster Centers: ")
ctr=[]
centers = model.clusterCenters()
for center in centers:
ctr.append(center)
print(center)
Below, the algorithm shows the squared Euclidean distance.
- If this number is negative, the data cannot be separated at all.
- Values closer to 1 indicate maximum separation.
- Values close to zero mean the data could barely be separated.
In this example, 0.57 is not bad.
Silhouette with squared euclidean distance = 0.5702065126840549
Within Set Sum of Squared Errors = 548301.9823949672
Cluster Centers:
[5.68235294e+01 5.68627451e-01 3.25490196e+00 1.35803922e+02
3.00078431e+02 1.47058824e-01 1.18627451e+00 1.45225490e+02
4.01960784e-01 1.09705882e+00 1.59803922e+00 8.23529412e-01]
[5.29821429e+01 7.44047619e-01 3.12500000e+00 1.28636905e+02
2.19047619e+02 1.48809524e-01 9.22619048e-01 1.52380952e+02
2.85714286e-01 1.02142857e+00 1.57738095e+00 5.77380952e-01]
In order to make to easily visualize it, we convert the Spark dataframe to a Pandas dataframe so we can use the Zeppelin function z.show to list the table.
%spark.pyspark
pandasDF=predictions.toPandas()
centers = pd.DataFrame(ctr,columns=features)
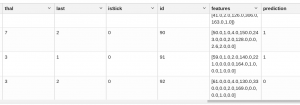
You cannot graph this data because a 3D graph allows you to plot only three variables. So, we can’t show how heart patients are separated, but we can put them in a tabular report using z.display() and observe the prediction column, which puts them in one category or the other:
%spark.pyspark
z.show(pandasDF)
As we can see, patients 90 and 91 are in cluster 1. Patient 92 is in cluster 0.
These postings are my own and do not necessarily represent BMC's position, strategies, or opinion.
See an error or have a suggestion? Please let us know by emailing [email protected].