Today, when all any of us can do is watch Coronavirus news, we show how to map the coronavirus using Tableau.
We use data gathered by the John Hopkins University School of Engineering. They have built this dashboard which has gained a wide following among news outlets around the world.
(This article is part of our Tableau Online Guide. Use the right-hand menu to navigate.)
John Hopkins Coronavirus Github
John Hopkins uploads that data to their github repository here every day. John Hopkins as of March 1st started adding longitude and latitude to the data feed.
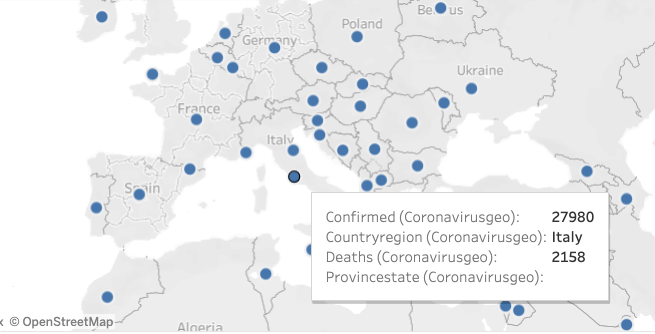
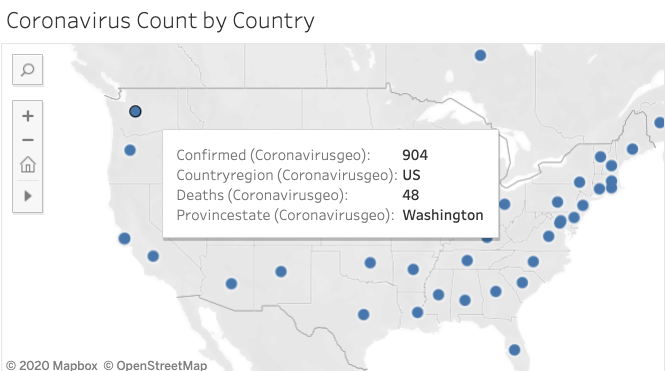
Tableau is well-suited to work with geographical data. We can upload it to Tableau and quickly turn it into the same kind of chart that John Hopkins has built. Then we can build a chart that looks much like what John Hopkins has built. Tableau knows that we want virus count by country. It’s fairly effortless to produce this kind of chart.
Our chart will look like this:
Download the Virus Data and Upload to a Database
To start, download the latest data:
wget https://raw.githubusercontent.com/CSSEGISandData/COVID-19/master/csse_covid_19_data/csse_covid_19_daily_reports/03-16-2020.csv
We are using PostgreSQL. You can use any of the databases that Tableau supports.
From the psql shell create a database, then create the coronavirusgeo database;
create table coronavirusgeo
( provinceState VARCHAR(50),
CountryRegion VARCHAR(50),
LastUpdate date,
Confirmed numeric,
Deaths numeric,
Recovered numeric,
Latitude numeric,
Longitude numeric);
Now load that data from the csv file into PostgreSQL:
COPY coronavirusgeo FROM '/home/ubuntu/Downloads/03-16-2020.csv' DELIMITER ',' CSV HEADER;
You do all that as the admin user. But you don’t want to use the admin account to connect to your PostgreSQL server from Tableau. So grant a designated user access to that database and table.
grant all privileges on database virus to walker;
grant all privileges on table coronavirusgeo to walker;
Connect the Database To Tableau and Create the Worldmap Chart
Connect the PostgreSQL database to Tableau. Then start adding fields on the chart.
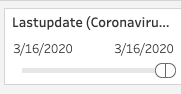
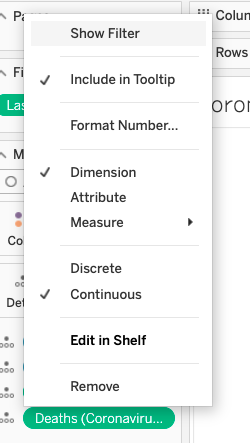
If you uploaded more than one daily report then you need to set a filter to select just that one day.
Set the filter 3/16/2020:

Then drag the fields longitude and lattitude to the columns and rows. Tableau will recognize these fields are in your data when you first connect to the coronavirus table and will assume that you want to map this data.
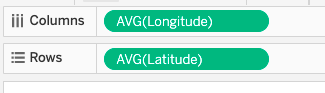
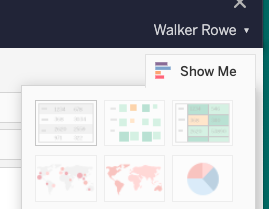
If it has not already done so, kick the World View chart type:
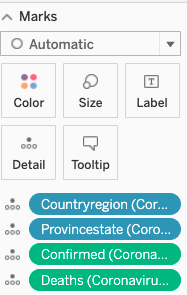
Add the fields below to the chart and change deaths and confirmed to dimension from sum.
Now you can zoom in on any part of the world and take a look. It displays numbers for the area on which you click.