
Data is a core part of any modern application. It is the catalyst for most technological functions and use-cases, from server, infrastructure, and application troubleshooting all the way to analyzing user behavior patterns and preferences and building complex machine learning models.
We need to collect data from various sources to achieve all these things. The ELK stack is one of the leading solutions when it comes to analyzing application or server data. It is a collection of three open-source products:
- Elasticsearch
- Logstash
- Kibana
Elasticsearch, based on the Lucene engine, is the storage and analytical backbone of the ELK stack. Kibana lets you visualize the data on Elasticsearch in any shape or form to gain better and easily understandable insights from data. Logstash is the ingest engine and the starting point of the ELK, which aggregates data from multiple services, files, logs, etc., and pushes it to Elasticsearch for further analysis.
In this article, we will focus on Logstash and how it can be used in a data processing pipeline.
(This article is part of our ElasticSearch Guide. Use the right-hand menu to navigate.)
What is Logstash?
Logstash is a free and open-source, server-side data processing pipeline that can be used to ingest data from multiple sources, transform it, and then send it to further processing or storage.
While Logstash is an integral part of the ELK stack, it does not mean Logstash is limited to use with those tools. It can push data not only to Elasticsearch but also to other services like Zabbix, Datadog, InfluxDB, MongoDB, and even to message brokers like RabbitMQ, Amazon SQS, etc.
Logstash consists of three core sections—inputs, filters, and outputs—as shown here:
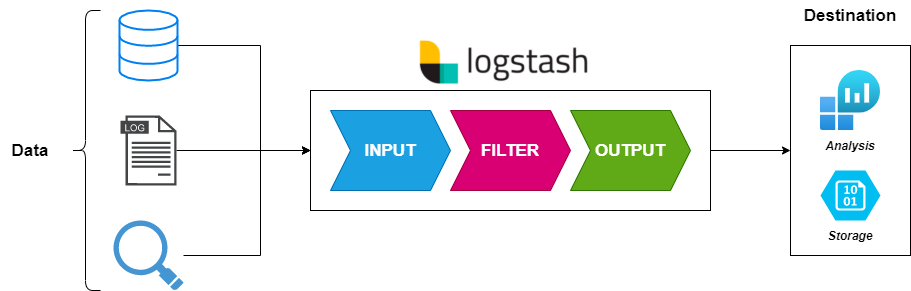
Logstash inputs
The primary feature of Logstash is its ability to collect and aggregate data from multiple sources. With over 50 plugins that can be used to gather data from various platforms and services, Logstash can cater to a wide variety of data collection needs from a single service. These inputs range from common inputs like file, beat, Syslog, stdin, UDP, TCP, HTTP, heartbeat to specific services such as azure event hub, Apache Kafka, AWS Kinesis, Salesforce, and SQLite.
Inputs are the starting point of Logstash configuration. By default, Logstash will automatically create a stdin input if there are no inputs defined. One of the most important considerations is that users will need to properly configure, categorize, and tag the inputs so that the data can be properly processed (filtered) and sent to its required output destination.
Logstash filters
What distinguishes Logstash from most other services is its ability to apply filters to the input data and process it. Unlike acting as a simple aggregator and pushing data, Logstash extracts information from raw data and transforms it into more meaningful common formats as an intermediary step before sending it for further processing or storage.
This process not only reduces the workload of further processing services like Elasticsearch; it also provides a common format that can be easily processed for better analysis of the gathered data. Logstash provides multiple filter plugins from a simple CSV plugin to parse CSV data to grok, allowing unstructured data to be parsed into fields to urldecode, etc.
Logstash outputs
The final part of Logstash is its output. As mentioned earlier, Logstash can output the collected (input) and processed (filter) data into a variety of outputs from Elasticsearch itself to simple files, storage services like S3, messaging services like SQS, and Kafka to other services like AWS CloudWatch and Google BigQuery.
All these plugins lead Logstash to become one of the most versatile solutions for gathering data.
Outputs are not limited to a single destination. By default, Logstash creates a stdout output if no outputs are configured. However, Logstash can be configured to push data to multiple destinations while filtering out specific inputs to specific outputs.
Configuring Logstash
Now that we understand the architecture of Logstash and what it can do, let’s look at how to configure Logstash. The primary requirement for Logstash is Java (JVM). Most Logstash architecture-specific installation bundles come with the necessary Java version bundled while allowing users to change the Java version as required.
Installing Logstash
Logstash can be installed on all major operating systems, including Windows, Linux, and macOS. Additionally, it provides support for Docker images as well as Helm Charts for direct Kubernetes deployments.
Let’s start with the following Docker Logstash example. Creating the Logstash container is a relatively straightforward process. Simply pull the Logstash image and then create the container with the Logstash configuration attached.
# Pull Image
docker pull docker.elastic.co/logstash/logstash:<version>
# Create Container - Config Folder
docker run --rm -it -v ~/config/:/usr/share/logstash/config/ docker.elastic.co/logstash/logstash:<version>
# Create Container - File Attached
docker run --rm -it -v ~/config/logstash.yml:/usr/share/logstash/config/logstash.yml docker.elastic.co/logstash/logstash:<version>
Logstash configuration structure
The format of a Logstash configuration file will consist of input, filter, and output sections, respectively. Single Logstash instance can have multiple configuration files that collect data from multiple services and filter then push to the desired destination. Typically, these configurations live in the /etc/logstash/conf.d/ folder with a file ending with the (.)conf file type.
The example below shows a simple Logstash configuration without filters that capture data from a file and output it to another file without any filtering.
read-log.conf
input {
file{
path => "/tmp/*.logs"
start_position => "beginning"
codec => json
}
}
output {
file {
path => "home/user/logstash_out.log"
}
}
If we look at a more comprehensive configuration file where we need to push Nginx logs to Elasticsearch, we can define it as follows:
nginx-logs.conf
input {
file {
type => "nginx"
path => "/var/log/nginx/*"
exclude => "*.gz"
}
}
filter {
if [type] == "nginx" {
grok {
patterns_dir => "/etc/logstash/patterns"
match => { "message" => "%{NGINX_ACCESS}" }
remove_tag => ["_grokparsefailure"]
add_tag => ["nginx_access"]
}
geoip {
source => "clientip"
}
}
}
output {
elasticsearch {
hosts => ["www.test.host:9200"]
}
}
Logstash alternatives
Logstash is powerful and versatile, yet it is not the simplest or the only solution in the market.
Due to its feature set, there will be a comparatively higher learning curve as well as higher configuration and resource requirements. In this section, we will explore some alternatives to Logstash that can act as the starting point of a data processing pipeline to ingest data.
Filebeat
Filebeat is a lightweight log shipper from the creators of Elastic stack. As a part of the beats family, Filebeat specializes in collecting data from specified files or logs. This, in turn, leads to Filebeat being less resource intensive than Logstash while providing the ability to collect and push data.
Filebeat is an excellent choice when users need simple data to ingest functionality. It can even be used as an input for Logstash. However, the major downside of Filebeat compared to Logstash is its limited functionality. Filebeat functionality is limited to only pushing collected logs, and the outputs are limited to Logstash, Elasticsearch, Kafka, and Redis.
Logagent
Logagent from Sematext is another open-source, cloud-native lightweight data shipper that is a direct competitor of Logstash. It provides the ability to filter the data collected via Logagent and supports multiple input and output options. These options include Syslog, file, azure vents, webhook, and even MySQL, MSSQL queries, etc., as inputs and ElasticSearch, Amazon ElasticSearch, Prometheus, etc. as outputs. Logagent also has a relatively gentle learning curve compared to Logstash.
However, as the more mature platform, Logstash offers more options when it comes to input, filter, and output and provides more flexibility to support different kinds of data ingestion and processing needs.
Fluentd
This open-source data collector is aimed at providing a unified logging layer. Fluentd is one of the reliable and extensible data collectors built with reliability and efficiency in mind. The major feature of Fluentd is that it will try to structure data as JSON as much as possible, thus allowing a much easier data processing experience for downstream (output) services. Fluentd is now a part of the CNCF project and provides integrations with over five hundred platforms, services, and technologies.
Fluentd is an excellent choice if you want to parse data in a structured format. However, it will require workarounds such as filtering via a regular expression, tags, etc., when users need to collect and push unstructured data. Furthermore, Fluentd can be a complex solution for beginners with a larger learning curve.
rsyslog
A Rocket-fast system for log processing or rsyslog is a log processor aimed at providing the highest performance. It can leverage modern hardware more efficiently with full multi-threading support. It is valuable when parsing data with multiple rules, and rsyslog can offer the same level of performance across the board for any number of rules. rsyslog also supports a multitude of input and output options with the ability to filter any part of Syslog messages.
The primary disadvantage of rsyslog is its complexity. For instance, correctly setting up and parsing data in rsyslog is the most complex process compared to other solutions. However, if you can overcome this configuration hurdle, rsyslog can offer a stable experience for most use cases.
Logstash is user-friendly, feature-rich
Logstash is one of the most user-friendly and feature-rich data collection and processing tools. As part of the ELK stack, Logstash has industry-wide recognition and adaptation to collect, aggregate, filter, and output data allowing users to build robust data processing pipelines.
Moreover, Logstash is one of the best options for ingesting data from various inputs and parsing and transforming it before sending it to storage or further analytics.